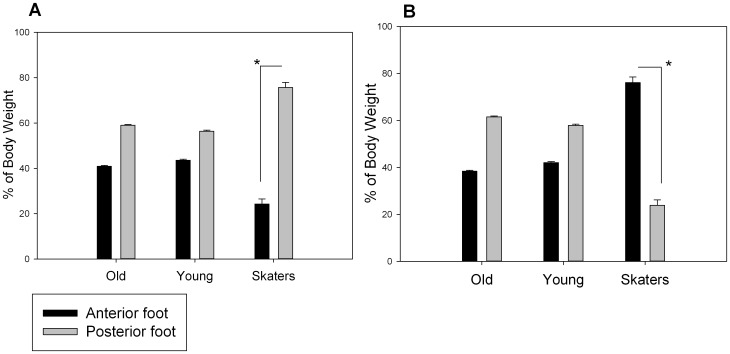
Figure 3. Means and standard deviations of the percentage of the total body weight produced during the jump by the three groups in the two force platforms (black bars represent the anterior and gray bars the posterior platform).
Left graph shows the time to peak detected during the takeoff while right graph the time to peak detected during the landing phase. The * symbol indicates the level of significance <0.05.

