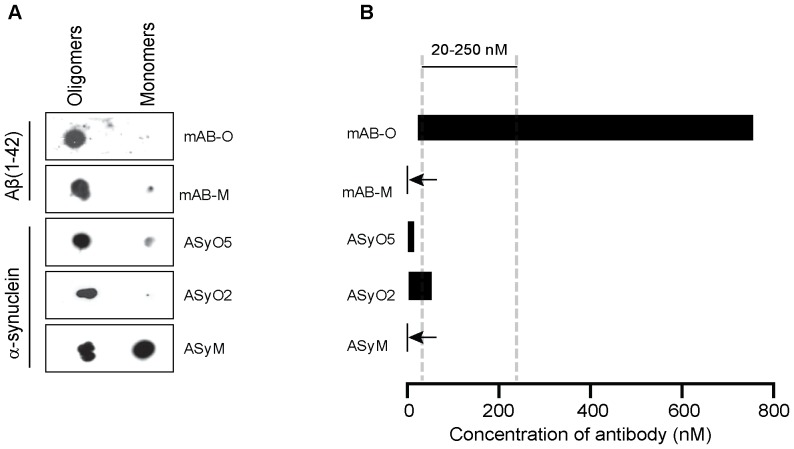
Figure 4. Therapeutic antibody concentrations require very low monovalent affinities to avoid reactivity to monomers.
(A)Non-logarithmic illustration of the antibody concentration range where more than 50% of the oligomers are bound while the saturation level to the monomer is below 2%. Note in particular the dramatic difference between mAB-O and mAB-M that both qualify as being oligomer specific according to the widely accepted dot blot technique. The bars corresponding to mAB-M as well as ASyM are indicated with arrows to highlight their appearance. For comparison, the most commonly used range of therapeutic antibody concentrations for AD (20 µM to 250 µM) is indicated in the figure (grey striped vertical bars). (B) Dot blot analysis where equal amounts of Aβ1–42 and α-synuclein oligomers and monomers has been applied on a membrane and probed with mAB-O, mAB-M, ASyO5, ASyO2, and ASyM as indicated in the figure.

