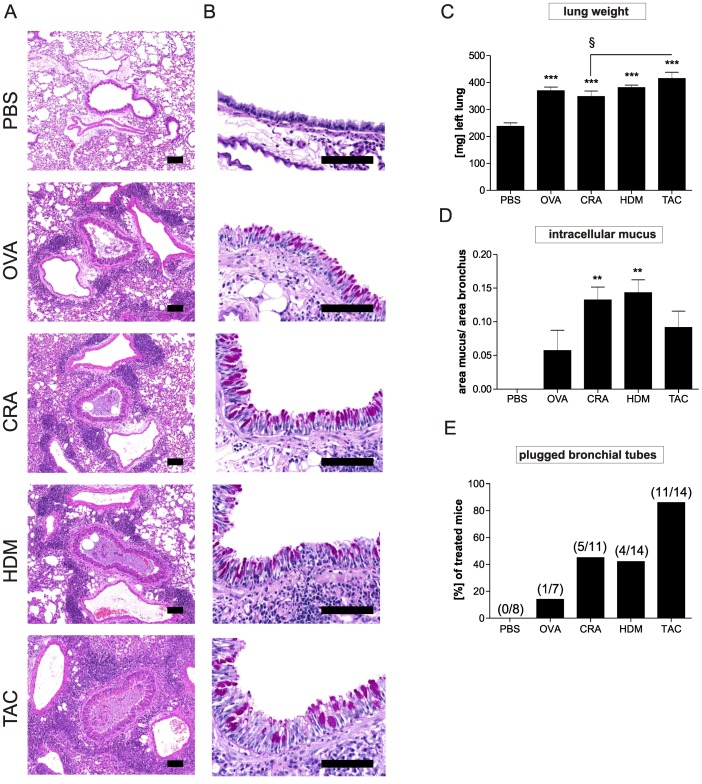
Figure 3. Inflammation and mucus production in the lung of the mice subjected to the different sensitization and challenge protocols.
Sections of the lungs were stained with haematoxilin/eosin (H&E) (A) and periodic acid-schiff (PAS) (B). Shown are representative sections of 8–12 mice/group. Scale bar = 100 µm. Wet weight of left lung is shown (C) and mucus production (D) was assessed by automated analysis of the main bronchus epithelium. Results represent mean ± SEM from 8–12 mice/group. **P<0.01; ***P<0.001 in comparison to the PBS control mice and § P<0.05 in comparison to the triple allergen combination (TAC) group. Mucus plugging (E) was scored manually analyzing whole lung cross sections from 7–12 mice/group as described in methods.

