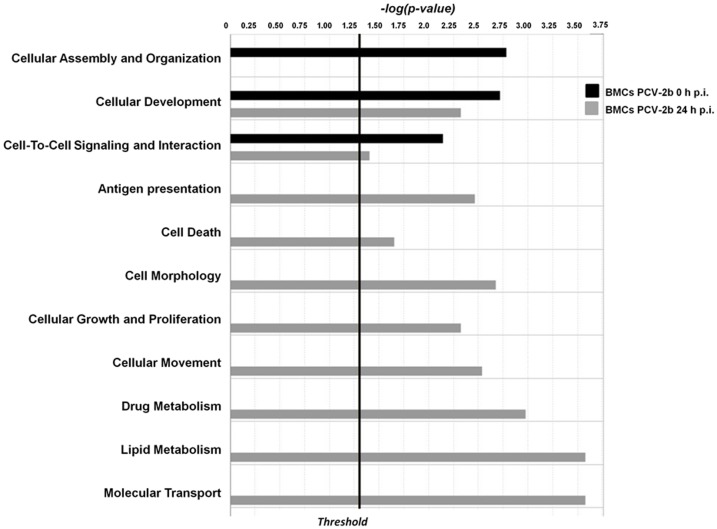
Figure 5. Biological process analysis of genes differentially expressed in BMCs at 1 h and 24 h post PCV2b challenge.
Differentially expressed genes (P<0.05) were imported into IPA Ingenuity software to determine significantly enriched biological processes. Data represent the distribution in cell function categories of statistically significantly enriched biological processes (P<0.05) at 0 h and 24 h post PCV2b challenge.

