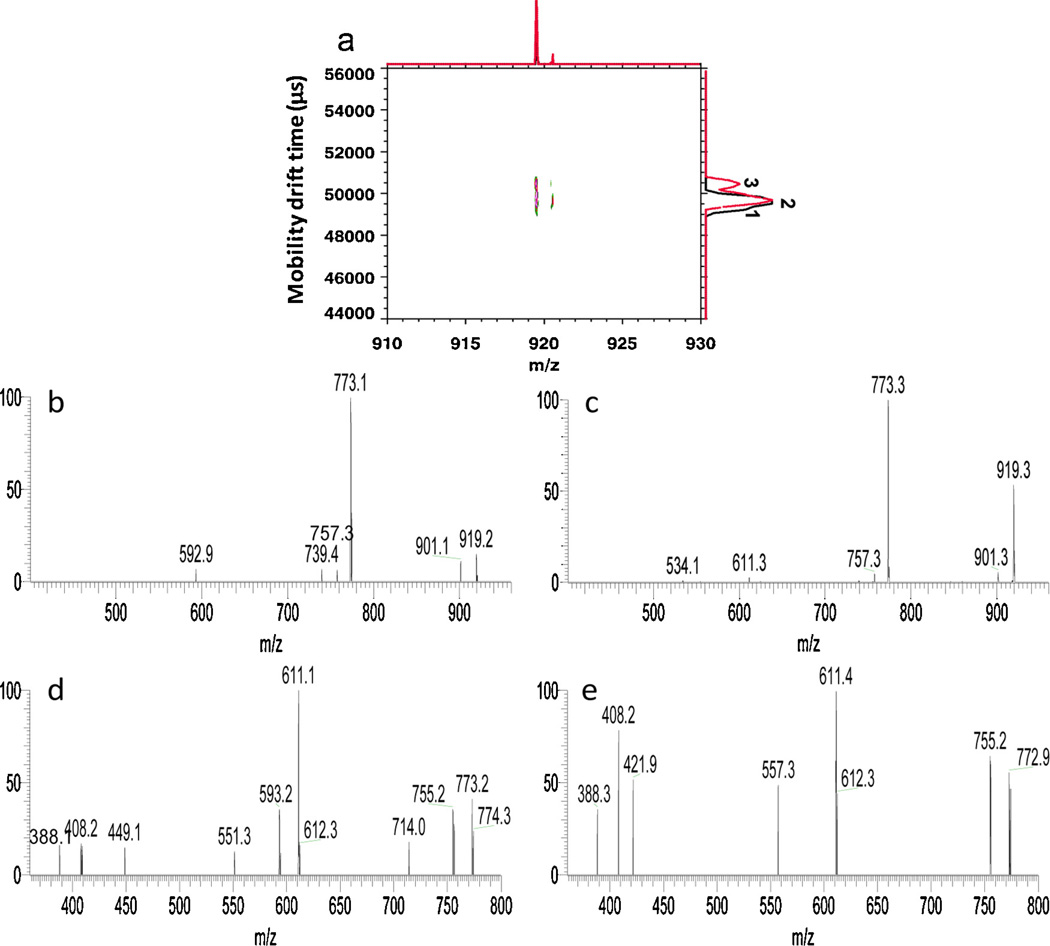
Fig. 5.
(a) Overlaid 2D IMMS spectra of the m/z 919 precursor ion from HPLC fractions 8 (black trace) and 9 (red trace) acquired on IM-TOFMS. (b) MS/MS spectrum of the m/z 919 precursor ion in HPLC fraction 9 of the 65.0–65.8 ms mobility window (peak 2) on the dual gate IM-QITMS. (c) MS/MS spectrum of the m/z 919 precursor ion in HPLC fraction 9 of the 66.4–66.9 ms (peak 3) mobility window on the dual gate IM-QITMS. (d) MS3 spectrum of the m/z 773 product ion derived from m/z 919 in HPLC fraction 9 of the 65.0–65.8 ms (isomer 2) mobility window on dual gate IM-QITMS. (e) MS3 spectrum of m/z 773 product ion derived from m/z 919 in LC fraction 9 of the 66.4–66.9 ms (isomer 3) mobility window on IM-QITMS. (For interpretation of the references to colour in this figure legend, the reader is referred to the web version of this article.)

