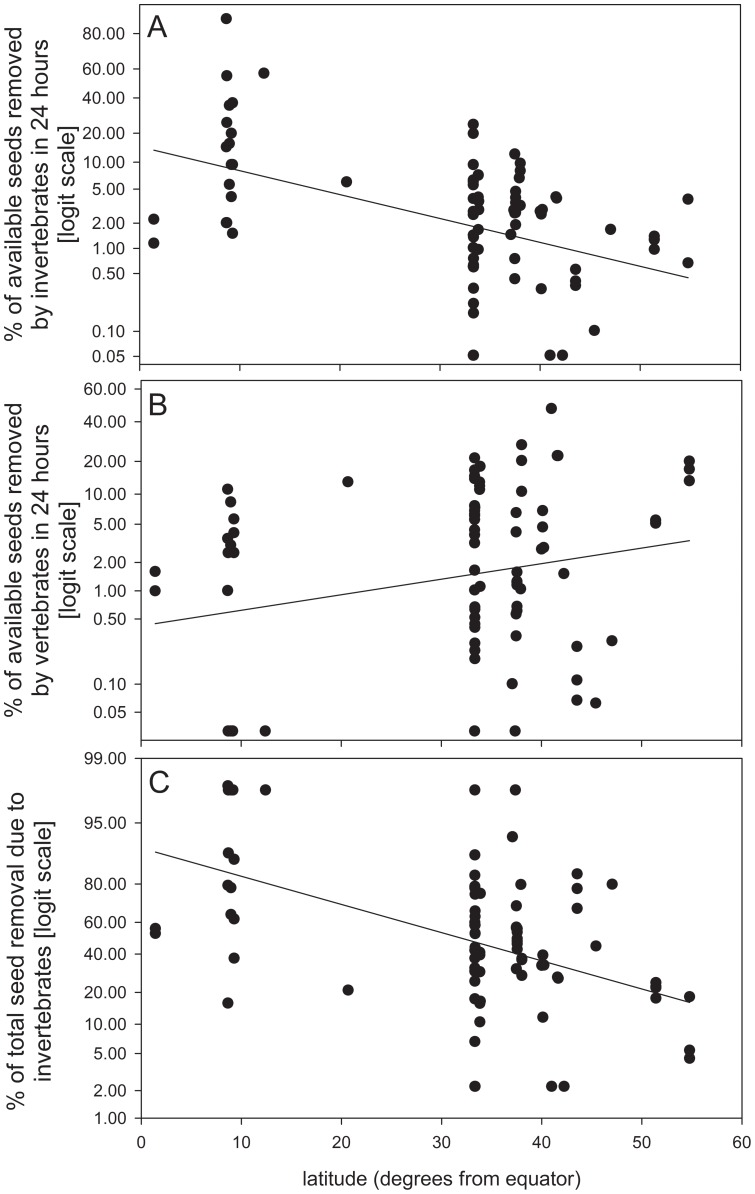
Figure 1. Percentage of available seeds removed in 24) invertebrates and b) vertebrates, and c) percentage of total seed removal due to invertebrates, in relation to latitude.
The lines represent model predictions according with the model parameters specified in Table 1.

