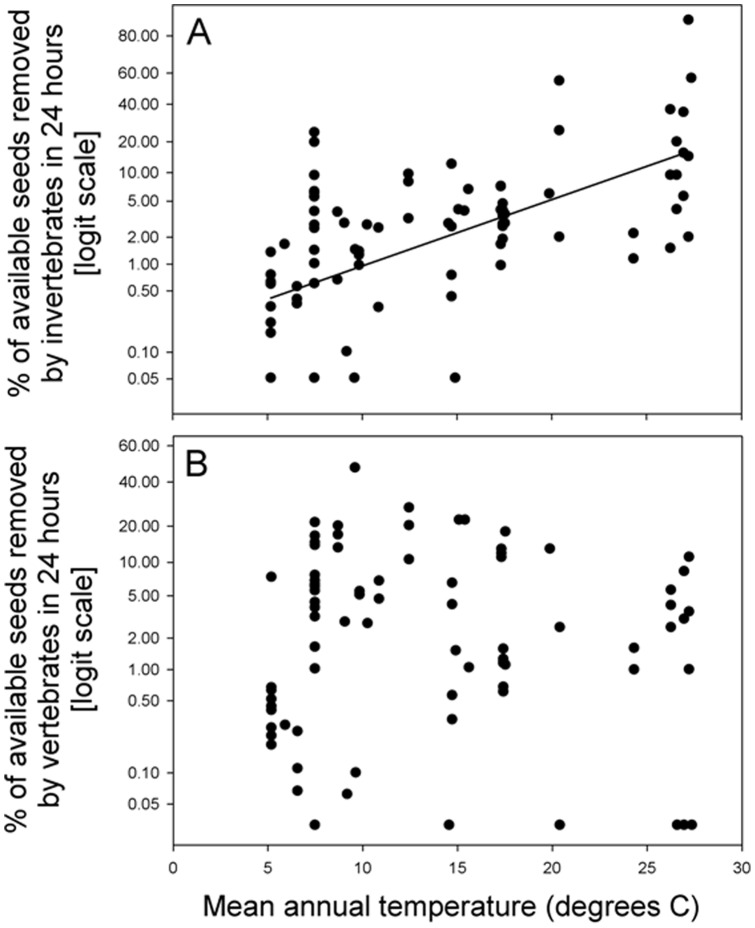
Figure 2. Percentage of available seeds removed in 24) invertebrates and b) vertebrates, in relation to mean annual temperature for the period 1950–2000 (climatic data from Hijmans et al. 2005, available at:http://www.worldclim.org).
The line represents model predictions according with the model parameters specified in Table 2.

