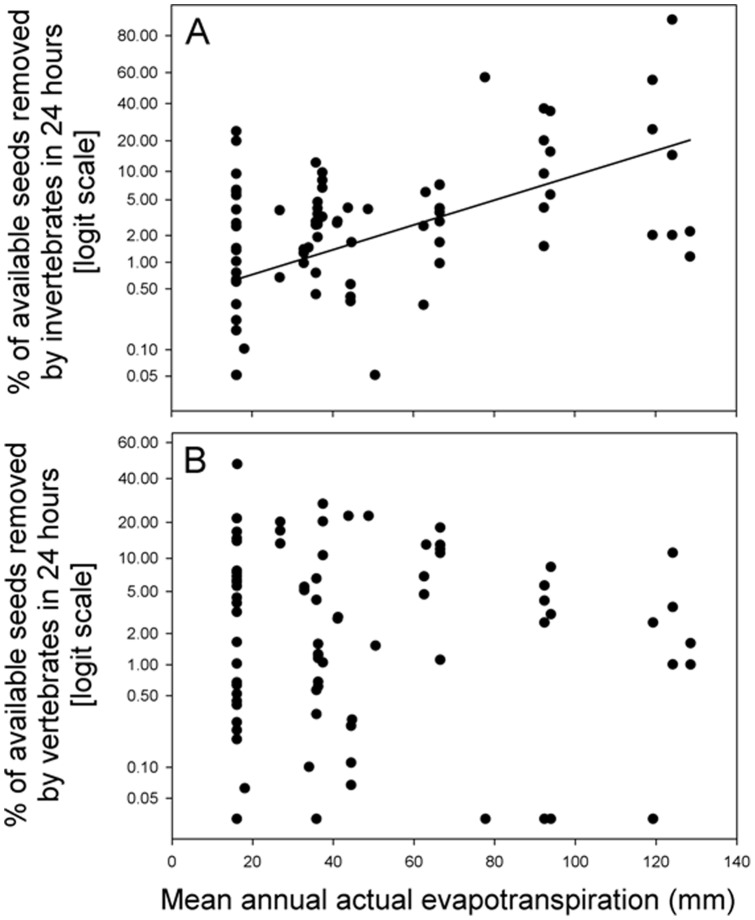
Figure 3. Percentage of available seeds removed in 24) invertebrates and b) vertebrates, in relation to mean annual AET for the for the period 1920–1980 (Ahn & Tateishi 1994, Tateishi & Ahn 1996, available at:http://www.grid.unep.ch/data/download/gnv183.zip).
The line represents model predictions according with the model parameters specified in Table 2.

