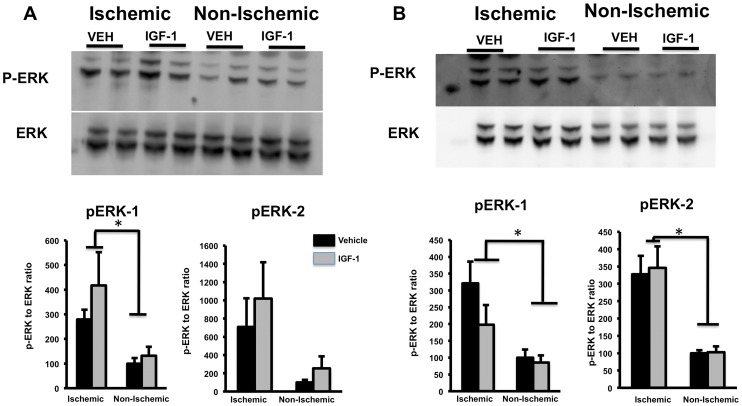
Figure 4. Phospho-ERK and pan ERK expression in post-ischemic brain.
pERK and pan ERK were analyzed by Western blot (top panels). pERK expression, normalized to ERK, are shown in the histograms (lower panels). (A) p-ERK1 level increased in the ischemic hemisphere at 4h, as compared to the non-ischemic hemisphere (main effect of hemisphere, p<0.05). (B) At 24h, both p-ERK1 & 2 were significantly increased in the ischemic hemisphere (main effect of hemisphere; p<0.05). IGF-1 did not affect pERK expression at either time point. Bars represent mean ± SEM. n = 6 in each group. *: p <0.05.

