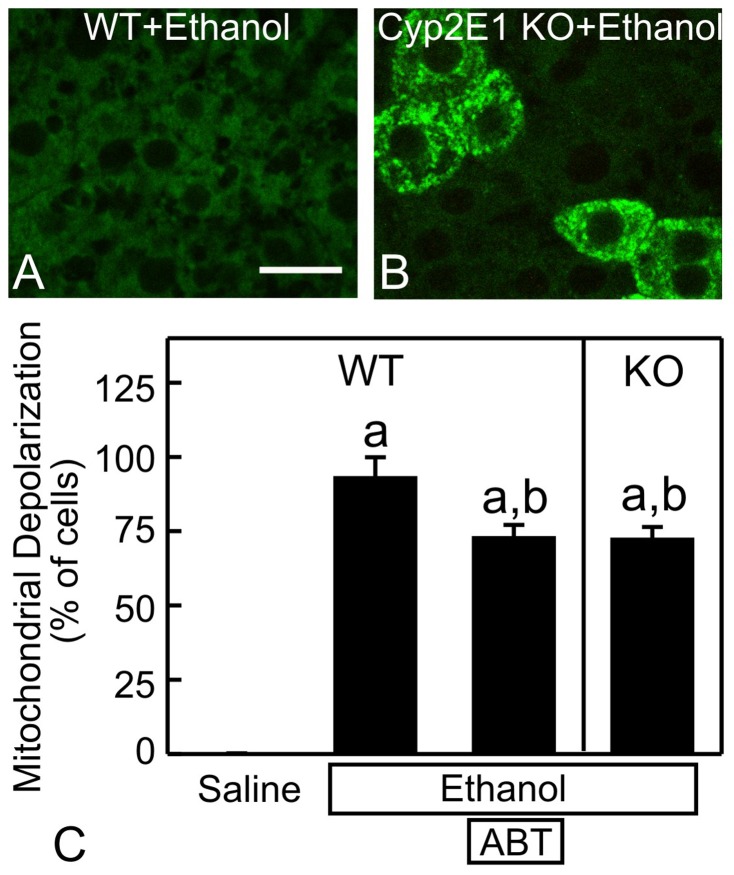
Figure 6. Role of cytochrome P450-dependent ethanol metabolism in mitochondrial depolarization.
Wild-type (WT) (A) and Cyp2E1 knock-out (KO) (B) mice were gavaged with ethanol (6 g/kg). Rh123 fluorescence was detected after 6 h. Some WT mice were pretreated with aminobenzotriazole (ABT, 100 mg/kg, i.p.), a cytochrome P450 inhibitor, 30 min prior to ethanol. In C, mitochondrial depolarization as a percentage of all hepatocytes is plotted. Values are means ± SEM (n = 4 per group). a, p<0.05 vs WT with saline; b, p<0.05 vs WT with ethanol. Bars are 10 µm.

