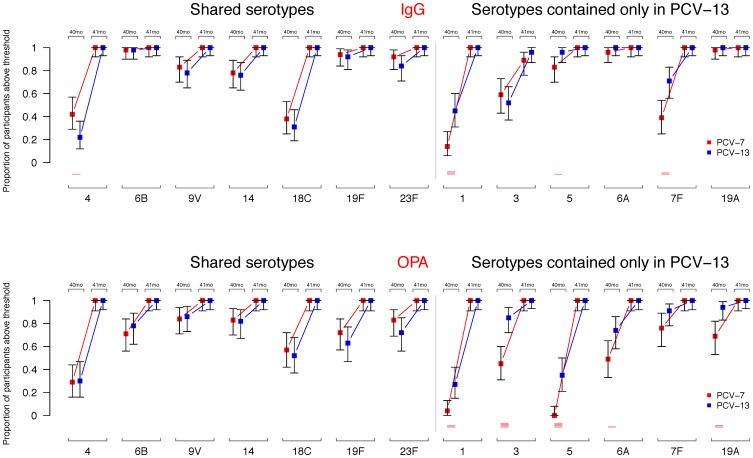
Figure 3. Proportion of participants with serotype-specific IgG concentrations and OPA titers above thresholds.
Proportion of participants with serotype-specific IgG concentrations and OPA titers above a threshold of 0.35 µg/ml and 8, respectively, for each of the serotypes before (40 months, 40 mo) and after (41 months, 41 mo) the PCV-13 booster. Shown are mean values along with their 95% confidence intervals. Red lines are shown at the bottom if p-values from chi-square test of proportions between the groups were significant (p-values ≤0.05, ≤0.01, ≤0.001, and ≤0.0001 are represented by 1, 2, 3, and 4 lines).

