
Figure 3. Angiogenesis is enhanced following low-intensity vibration.
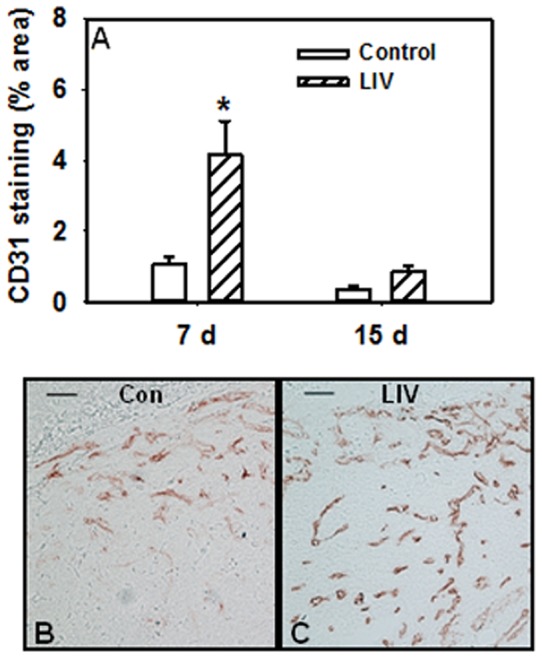
Wound sections were stained with antibodies against CD31 (a). Representative images of CD31 stained sections (b and c), scale bar = 0.5 mm. *Mean value significantly different from that of control for same time point, P≤0.05. 7 d, n = 12–14 per group; 15 d, n = 10 per group. Photomicrographs show granulation tissue from the center of the wound and are oriented such that the epidermis would be on top of the image and the wound margins would be on either side; however, the epidermis and wound margins are not visible at this magnification (20×).