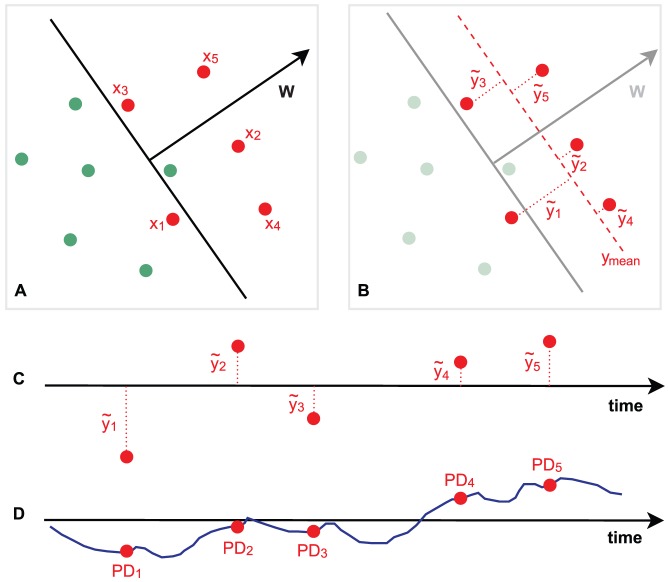
Figure 1. Methodology for correlating EEG single-trial variability with baseline pupil diameter.
(A) We first estimate w, which is a linear weighting on the EEG sensors that maximally discriminates stimulus conditions: targets (red) vs. standards (green), shown in two dimensions for illustration purposes. This determines a task-relevant projection of the data, where the distance to the decision boundary reflects the decision certainty of the classifier. (B) From w we compute  , which is the demeaned classifier output,
  , for each target trial, i. (In the text we refer to this variable as post-EEGcomp). (C) Given the
  's (post-EEGcomp) and their corresponding stimulus-onset time points, we compute the correlation with (D) baseline pupil diameter. This entire method was applied independently for multiple temporal windows,
  , spanning the trial.

