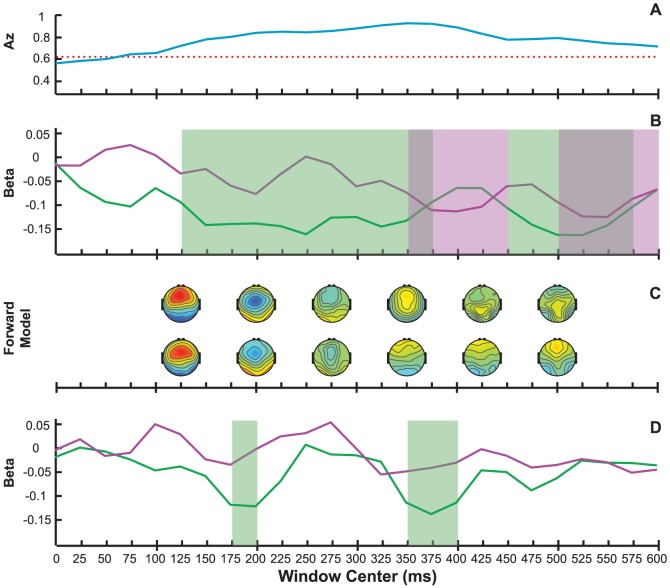
Figure 4. GLM fits of RT and baseline pupil diameter (pre-PD) to EEG components (post-EEGcomp).
Shown are group-level results for EEG windows spanning the trial, with shaded regions denoting p<0.05 (corrected) significance for linear (green) or quadratic (purple) relationships. (A) EEG classifier performance as defined by area under the ROC curve (blue trace). p = 0.01 (Az = 0.62) threshold is indicated with a red dotted line. (B) Linear (green) and quadratic (purple) GLM fit coefficient estimates,  , between RT and post-EEGcomp (classifier output y) as a function of window time. (C) Subset of scalp topographies generated using y (top row) and residual y (after regressing out RT, bottom row). (D) Linear (green) and quadratic (purple) GLM fit coefficient estimates between pre-PD and post-EEGcomp.

