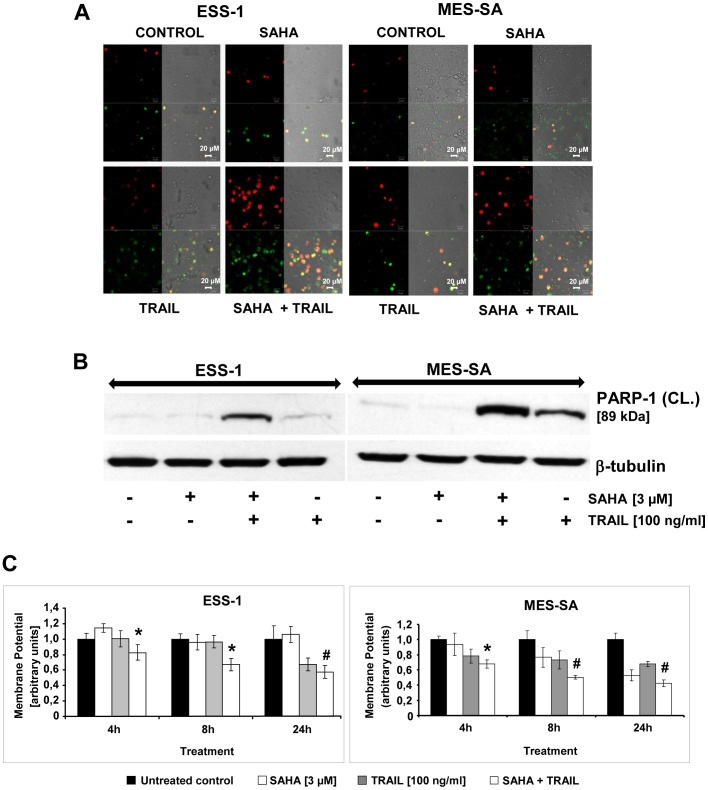
Figure 2. SAHA/TRAIL treatment induces apoptosis in uterine sarcoma cells involving the mitochondrial pathway.
Confocal laser scanning microscopy of ESS-1 and MES-SA cells which were stained after 8 hours of 3 μM SAHA and/or 100 ng/ml TRAIL treatment with YoPro-1/PI in order to detect apoptotic and non-apoptotic cells (A). Control cells received neither SAHA nor TRAIL treatment. Red staining (PI) represents dead or necrotic cells, green staining (YoPro-1) represents apoptotic staining, merged (yellow/orange) staining represents secondary apoptotic cells (uptake of both dyes), and no staining represents living cells. Representative images of three independent experiments that were acquired at 505 to 530 nm for the green channel and 543 nm for the red channel are shown (magnification 40 x). (B) Western blot analysis of ESS-1 and MES-SA cells treated for 8 hours with 3 μM SAHA and/or 100 ng/ml TRAIL for PARP-1 in order to demonstrate apoptotis. Untreated cells were used as control. Cell extracts were prepared, subjected to SDS-PAGE (30 μg of protein; 4-12% Bis-Tris gel), and immunoblotted with antibodies against cleaved PARP-1 (89 kDa) and β-tubulin (for loading control). The presented 89 kDa PARP-1 fragment is only processed during induction of apoptosis but not necrosis [41]. (C) The mitochondrial membrane potential (Δψm) was determined in uterine sarcoma cells (1×10⁴ cells per well) by JC-1 staining for confirming involvement of the intrinsic pathway of SAHA/TRAIL-induced apoptosis. Upon collapse of the Δψm, JC-1 molecules can enter mitochondria where they form red J-aggregates. The red (∼590 nm; high Δψm) to green (∼529 nm; low Δψm) ratio therefore indicates the amount of apoptosis in SAHA/TRAIL-treated cells after 4, 8, and 24 hours in arbitrary units. Mitochondrial depolarization in dead cells or cells undergoing apoptosis is indicated by a decrease in the red/green fluorescence intensity ratio. Asterisks (* p<0.05) or number signs (# p<0.001) indicate statistically significant differences between the combined SAHA/TRAIL treatment and the untreated control.

