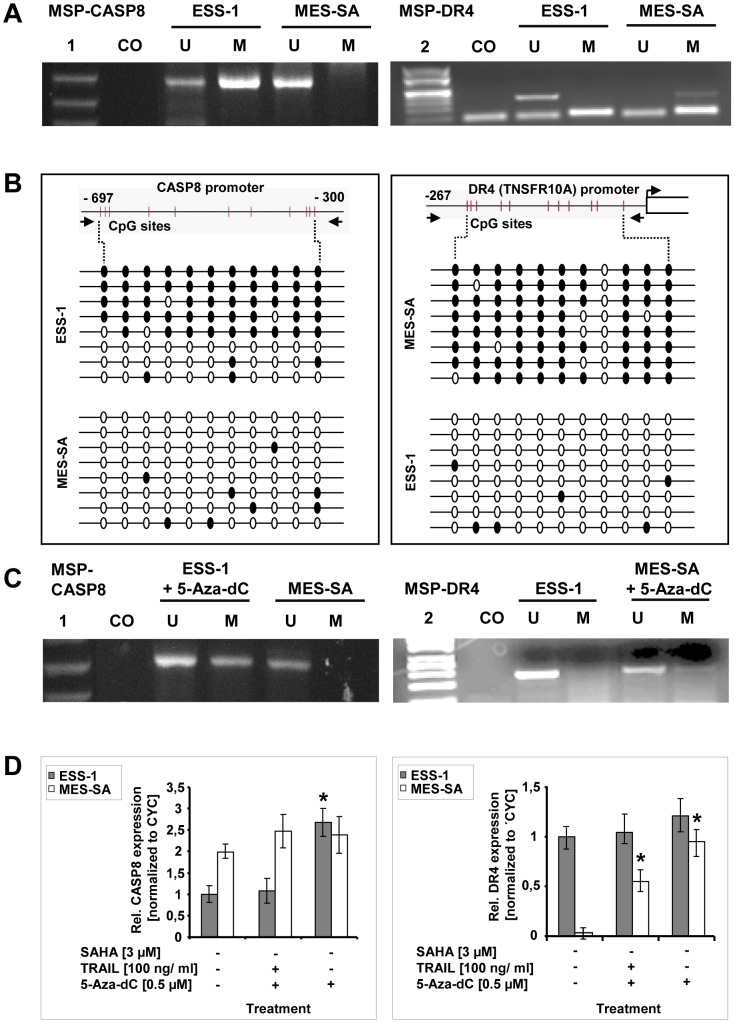
Figure 5. Promoter hypermethylation, and demethylation analysis of caspase-8 and DR4 genes in uterine sarcoma cells.
Methylation-specific PCR (MSP) [36] of bisulfite treated genomic DNA, isolated from untreated ESS-1 and MES-SA cells, was performed of the promoter regions of caspase-8 and DR4 (TNSFR10A) for assessing the methylation status (A). Amplification with the help of primer pairs that either bind unmethylated (U) or methylated (M) DNA was conducted before the PCR product was visualized by gel electrophoresis. Unmodified genomic DNA was used as a negative control (CO). Note that the lower band in the MSP performed for DR4 represents primers. Following DNA standards were used: (1) Gene ruler 50 bp DNA ladder; (2) λBst91I marker. (B) Bisulfite sequencing analysis [37], [38] of the caspase-8 and DR4 promoter regions in ESS-1 and MES-SA cells for identifying individual 5-methycytosine residues in genomic DNA. Eleven CpG sites located upstream of the transcription start site, between nucleotides – 300 and -697 for caspase-8, or nucleotides – 27 and – 267 for DR4, were analyzed for DNA methylation. Bisulfite converted genomic DNA, was amplified by PCR, subcloned, and sequenced by the Sanger method. The results of eight sequenced clones are depicted schematically for each promoter region and cell line, respectively. Methylated and unmethylated CpG nucleotides are presented as black or white circles, respectively. (C) MSP analysis as in (A) upon treatment of cells for 5 days with 0.5 μM 5-Aza-dC for examining induced alterations in genomic DNA methylation pattern for the CASP8 and DR4 promoter regions. Corresponding untreated cells were used as control. (D) Expression analysis of 5 day 5-Aza-dC treated ESS-1 and MES-SA cells for relative caspase-8 and DR4 expression by qRT-PCR. Triplicate ct values of three independent experiments were normalized to cyclophillin (CYC) expression and averaged. The depicted graphs represent the relative expression values as compared to the untreated control. Asterisks (* p<0.05) indicate statistically significant differences as compared to the untreated control.

