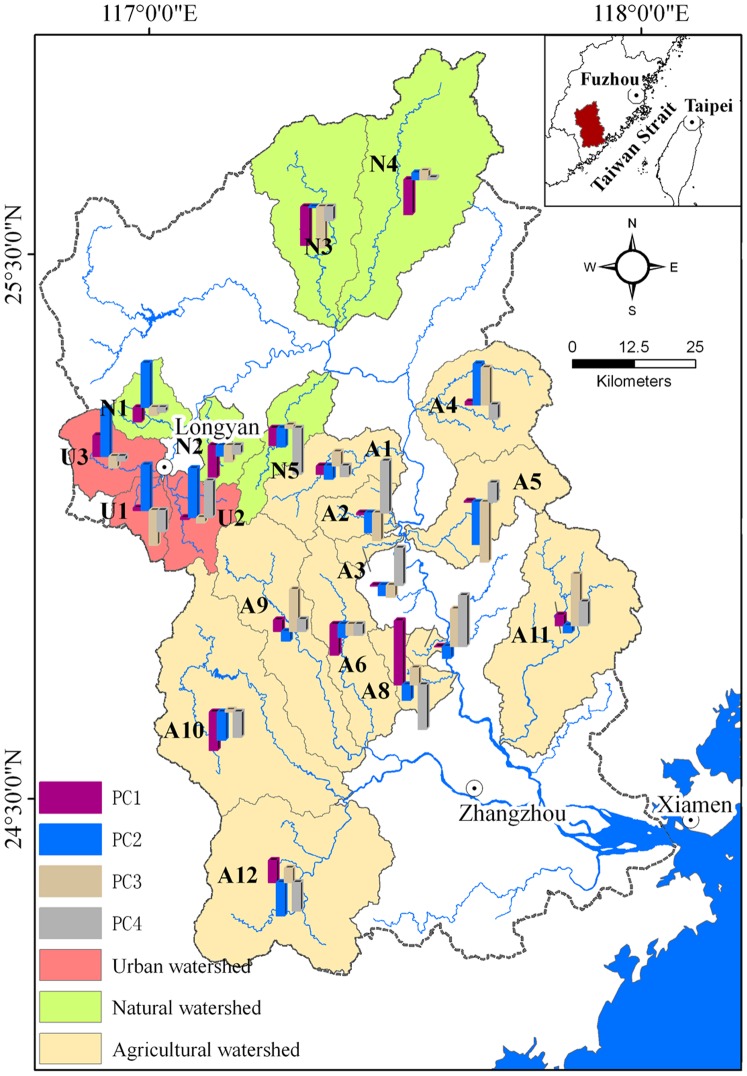
Figure 6. The four potential pollution sources identified to explain spatiotemporal variations in water quality for 20 headwater watersheds in the JRW.
(PC1, PC2, PC3, and PC4 represents landscape patterns, urbanization and socioeconomic development, agricultural activity, and natural control, respectively).

