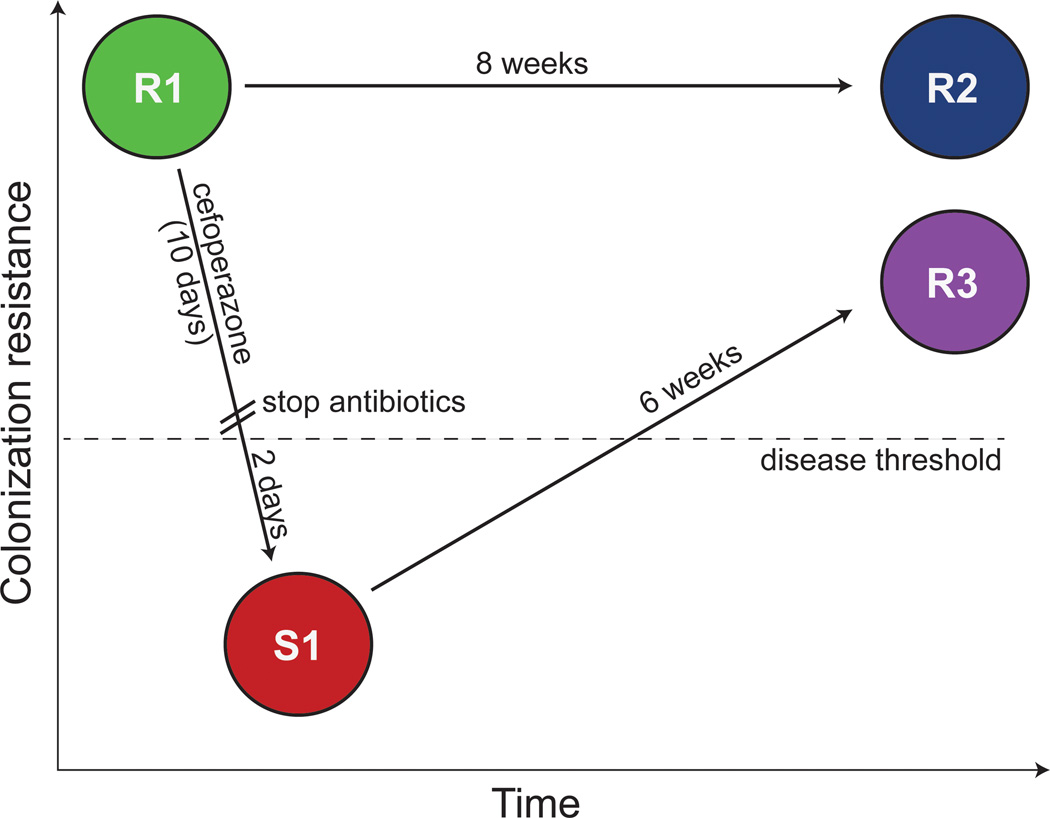
Figure 1. Susceptible and resistant states of C. difficile infection.
Each circle represents the state of the intestinal environment for each of the 4 treatment groups. C57BL/6 WT mice (represented at baseline by state R1) were treated with cefoperazone for 10 days. The structural and functional status of the gut was determined two days (S1) or 6 weeks (R3) after discontinuation of the antibiotic. An additional group of mice (R2) was held without any antibiotic treatment to serve as age-matched controls to the R3 animals. Each treatment group was challenged with C. difficile spores to assess if they were resistant or susceptible to colonization and disease. There were 3 states that were fully resistant to colonization and disease (R1, R2, R3) and one susceptible state (S1).

