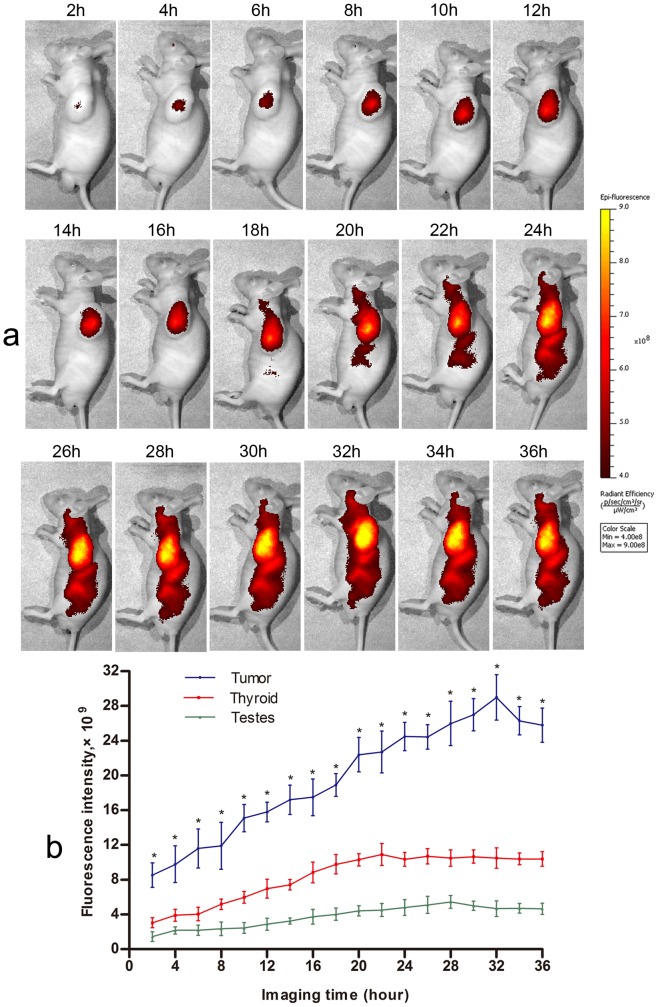
Figure 3. Representative in vivo imaging of tumor bearing mouse after injection with the cathepsin B probe (n = 6).
(a) A strong specific fluorescence signal in tumor site for 36 hrs. (b) Comparison of fluorescence intensities in tumor site and thyroid/testis at each time point (* p<0.05 when compared with thyroid and testis). Error bars represent SD.

