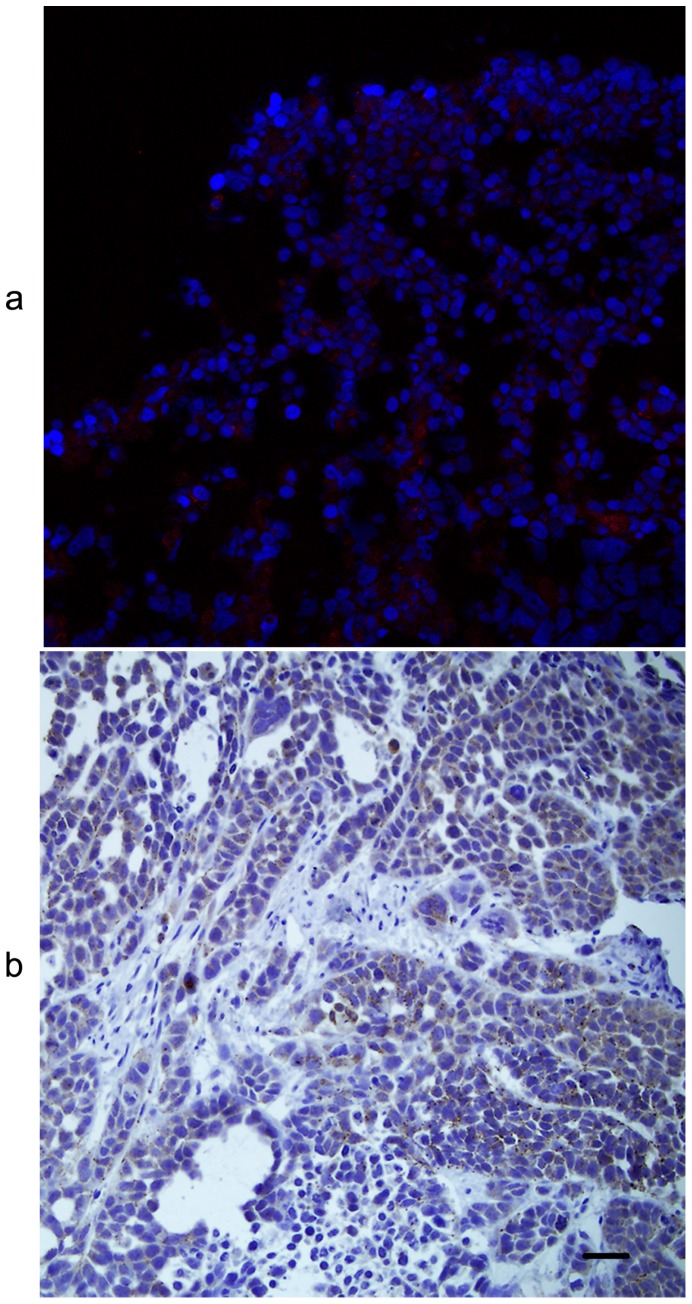
Figure 5. Near-infrared fluorescence (NIRF) histology of the resected tumor xenografts.
(a) NIRF signals (red) of the cathepsin B (CB) probe in the cytoplasm of Eca-109 tumor cells counterstained with DAPI (blue). (b) CB expression (brown) in the cytoplasm of Eca-109 tumor cells which coincided with the location of NIRF signals of the CB probe. Original magnification, 200×.

