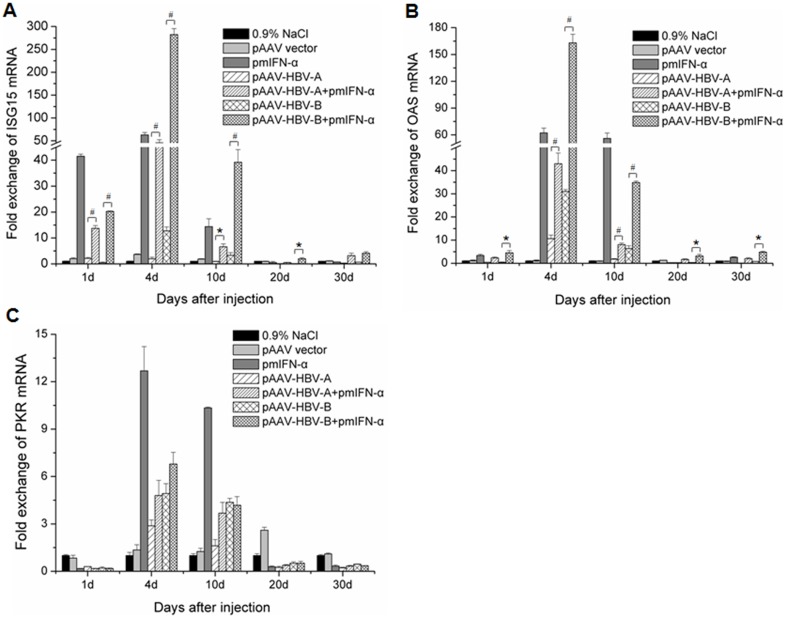
Figure 4. Induction of ISG15, OAS and PKR expression in the mouse liver after HI.
Mice received HI with 10 µg of HBV clones or pmIFN-α alone or combination of HBV clones and pmIFN-α. The mice injected with 0.9% NaCl or pAAV vector, were used as control. Total RNA was extracted form liver tissue of the mice at the indicated time points after HI and the levels of ISG (A), OAS (B) and PKR (C) mRNA were determined by quantitative real-time RT PCR. The β-actin mRNAs were quantified for normalization. Each sample was run in duplicate and at least three mouse liver specimens per group were analyzed (n≥3). Differences between the groups were analyzed by using the t test: * means p<0.05 and # means p<0.01.

