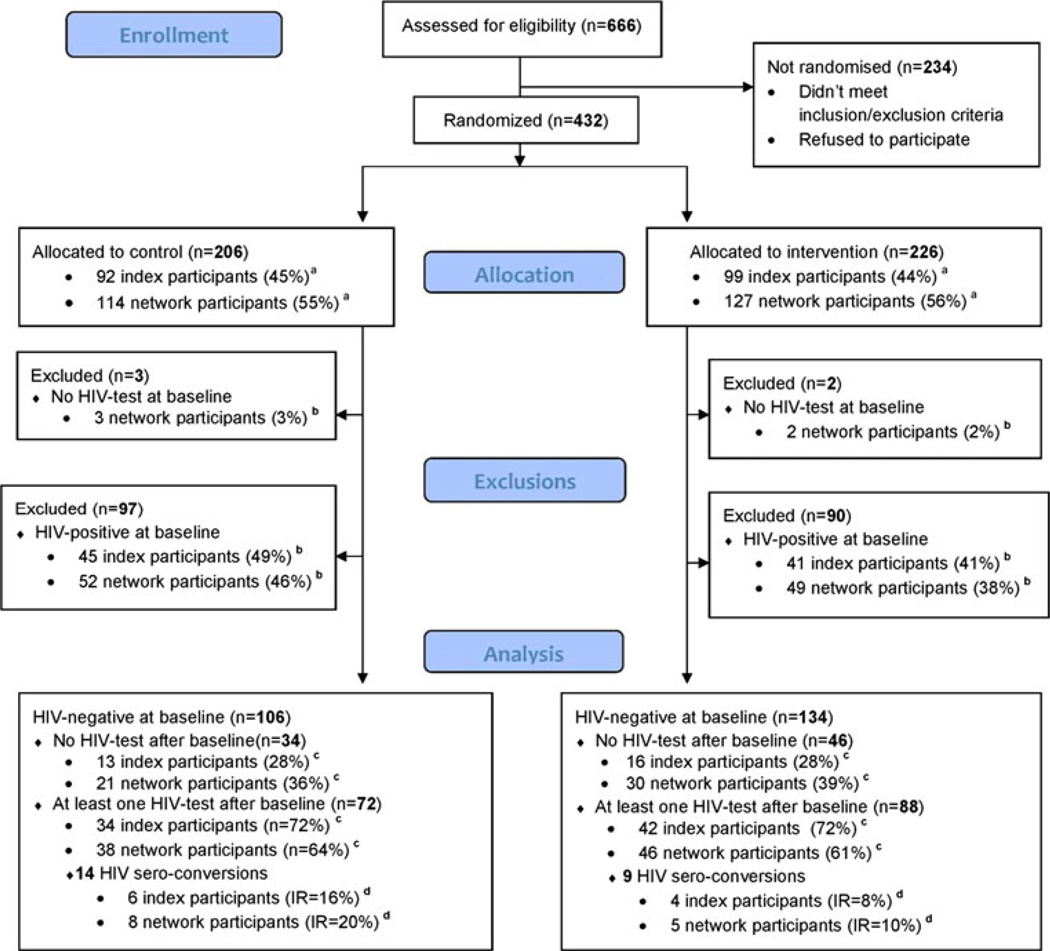
Fig. 1.
Participants flow diagram. a Percentage of individuals allocated to specified group (control or intervention). b Percentage of individuals belonging to specified subgroup (network cases of index cases). c Percentage of HIV-negative individuals belonging to specified subgroup (network cases of index cases). d Incidence rate (per 100 p/y)

