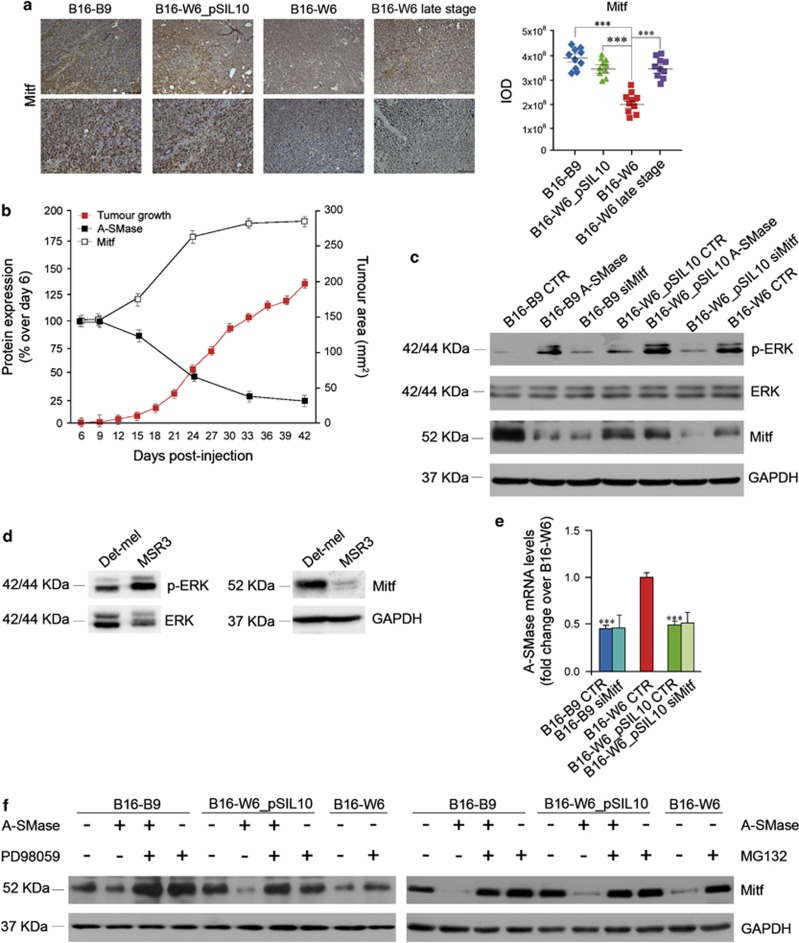
Figure 6.
A-SMase modulates melanoma progression through the regulation of Mitf. (a) Mitf staining and quantification in B16-B9, B16-W6_pSIL10, B16-W6 and B16-W6 late stage-derived tumours (three animals per group). Images shown are representative of 1 out of 12 tumours per group (top, scale bar, 110 μm; bottom scale bar, 55 μm). Graphs show the quantification (expressed as IOD). Error bars: S.E.M.; n=4. (b) C57BL/6 mice were injected in the right flank with B16-W6 (2.5 × 10⁴ cells); tumour growth (gray trace) was monitored by measuring tumour area (mm2) every 3 days (n=4). Values are expressed as mean±S.E.M. In parallel A-SMase (full squares) and Mitf (open squares) expression in tumours was evaluated at the indicated times by immunohistochemistry quantification (n=4). Values are expressed as the % of protein expression over tumour at day 6 after cell injection±S.E.M. (c) Western blotting of Mitf, phospho-ERK (p-ERK), ERK and GAPDH performed on B16 cells untreated (B16-B9, B16-W6 and B16-W6_pSIL10) here referred to as CTR, and transfected with a pEF1-A-SMase vector or with a specific Mitf siRNA (B16-B9 and B16-W6_pSIL10), here referred as A-SMase and siMitf respectively. Images shown are representative of one out of four reproducible experiments. (d) Western blotting of Mitf, GAPDH, phospho-ERK (p-ERK) and ERK performed on Det-mel and MSR3 cells. Images shown are representative of one out of three reproducible experiments. (e) qPCR of A-SMase on mRNA extract from B16 cells untreated (B16-B9-, B16-W6- and B16-W6_pSIL10-CTR) and transfected with Mitf siRNA (B16-B9- and B16-W6_pSIL10-siMitf). Values are expressed as mean±S.E.M. (n=4). (f) Western blotting of Mitf and GAPDH performed on B16 cells untransfected or transfected with a A-SMase cDNA (A-SMase) in the presence or absence of PD98059 (40 μM) (left panel) or MG132 (1 μM) (right panel). Images shown are representative of one out of three reproducible experiments. Asterisks in a and c indicate statistical significance versus B16-W6; ***P<0.001

