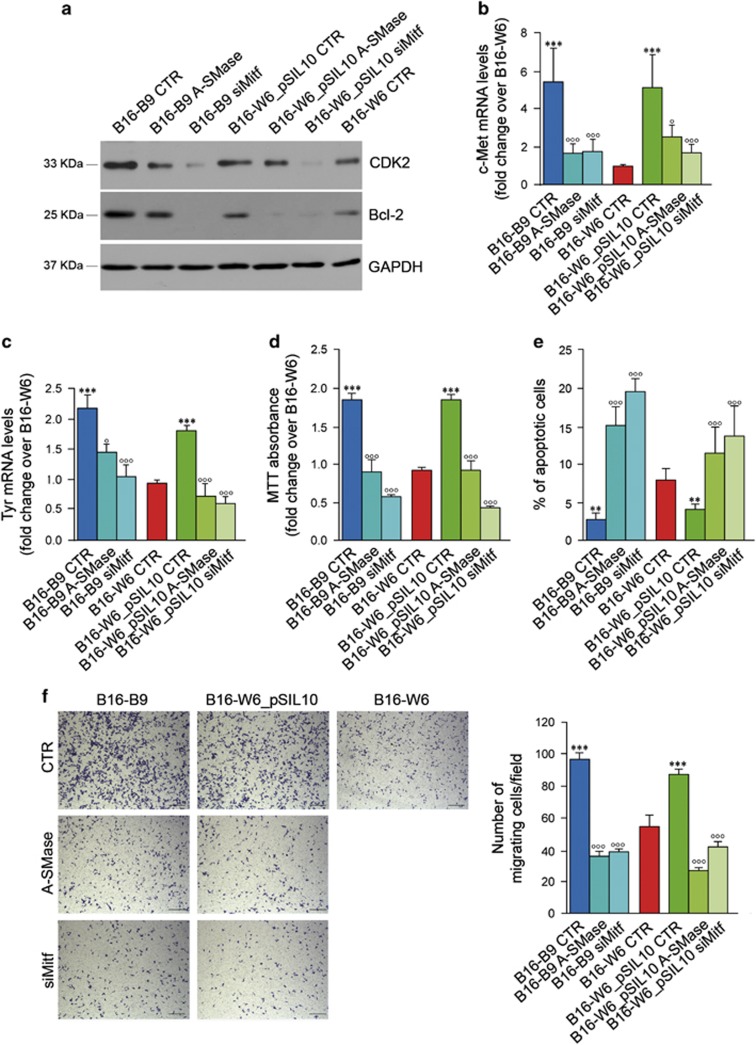
Figure 7.
A-SMase regulates melanoma cells behaviour and phenotype through the modulation of Mitf downstream targets. Proliferation (a and d), apoptosis (a and e), migration (b and f) and pigmentation (c) rate evaluation on B16 cells untreated (B16-B9, B16-W6 and B16-W6_pSIL10) here referred to as CTR, and transfected with a A-SMase cDNA or with Mitf siRNA, here referred to as B16-B9- and B16-W6_pSIL10-A-SMase and B16-B9- and B16-W6_pSIL10-siMitf respectively. (a) Western blotting of CDK2, Bcl-2 and GAPDH. Images shown are representative of one out of four reproducible experiments. (b–c) qPCR of c-Met and Tyr on mRNA extract. Values are expressed as mean±S.E.M. (n=4). (d) MTT analysis of cell viability following 48 h of culture in normal condition (medium added with 10% FBS). Values are expressed as fold increase over control (B16-W6 cells)±S.E.M. (n=6). (e) Apoptosis was assessed by flow cytometry measuring phosphatidylserine exposure onto the plasma membrane by the staining with Annexin V-FITC. Values are expressed as % of apoptotic cells±S.E.M. (n=4). (f) Migration assay. Cells were plated onto a polycarbonate membrane using 3T3 fibroblast-conditioned medium as source of chemoattractants. After 6 h of incubation, the cells migrated onto the lower surface of the membrane were stained with crystal violet and visually counted in 10 random fields. Images are representative of three different reproducible experiments (scale bar, 110 μm). Values are expressed as mean±S.E.M. (n=3). Circles and asterisks in b–f indicate statistical significance versus the untransfected parental cells and B16-W6, respectively; °,*P<0.05; °°,**P<0.01; °°°,***P<0.001

