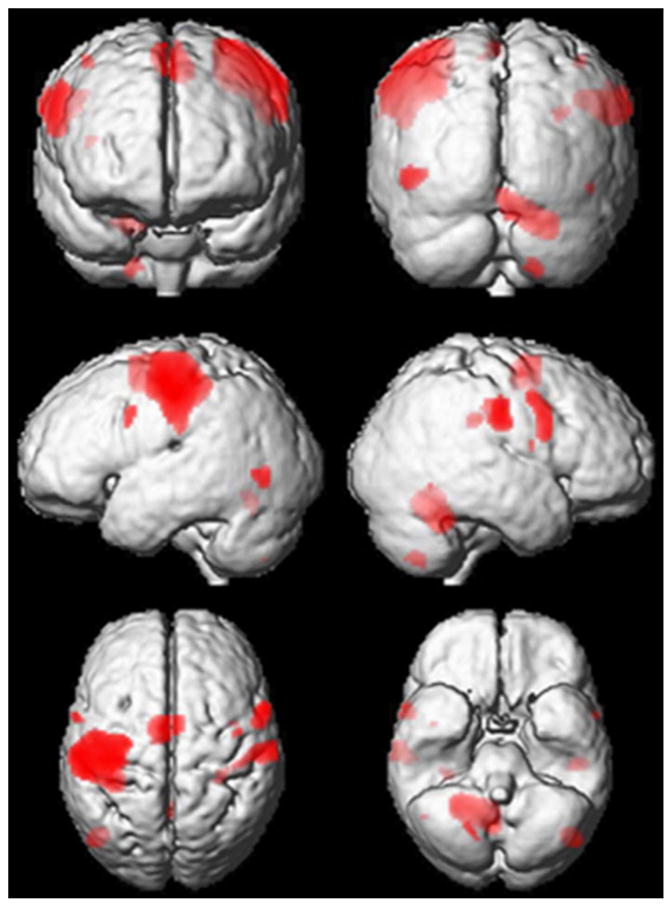
Fig. 2.

Significantly active clusters from conjunction analysis. Significantly active clusters for the conjunction between active conditions are superimposed on a three-dimensional rendering of the group mean anatomical image (T1w). Significant peak activations resulting from this analysis are found in Table 1
