Figure 4.
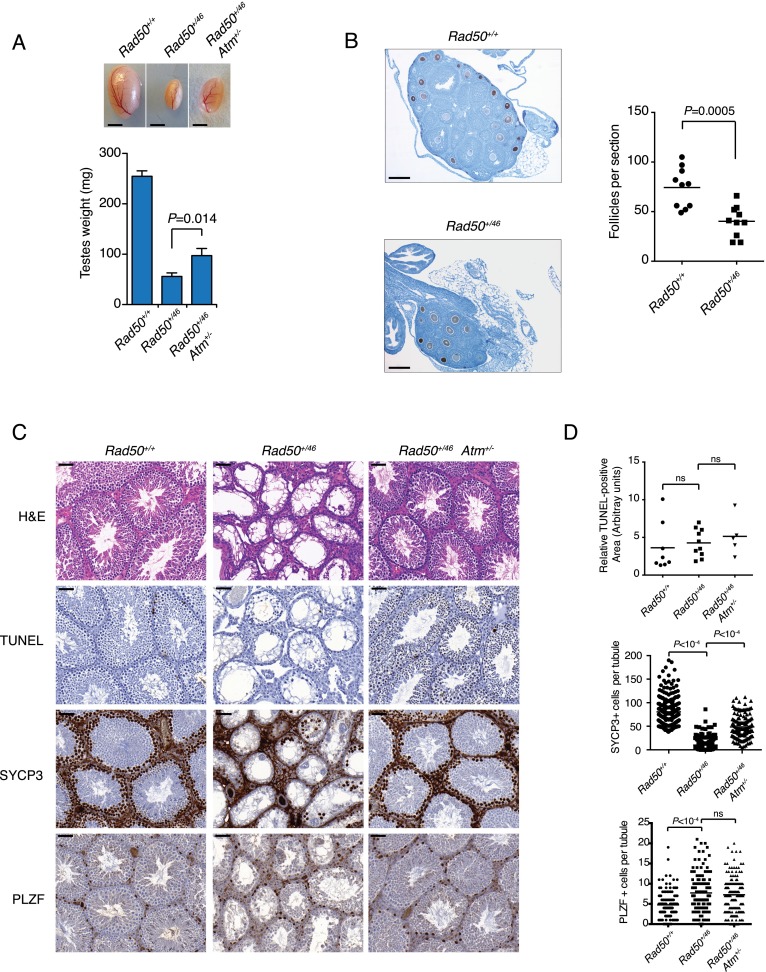
Germ cell dysfunction in Rad50+/46 mice. (A) Representative images of testis from mice of the indicated genotypes and average testes weight ± SEM (Rad50+/+, n = 7; Rad50+/46, n = 8; Rad50+/46, Atm+/− n = 5). Bar, 2.5 mm. (B) Representative images of anti-VASA-stained mid-ovary sections from 3-wk-old mice and quantification of the number follicles. Bar, 0.4 mm. Ovaries analyzed: n = 10. P-value was determined by unpaired t-test. (C) Hematoxylin and eosin (H&E), TUNEL, SYCP3, and PLZF immunohistochemical staining of testis sections from adult mice of the indicated genotypes. Bar, 50 μm. (D) Quantification of immunohistochemical staining from C. The TUNEL-positive area is expressed as a ratio to the total testis area. Testis analyzed: Rad50+/+, n = 8; Rad50+/46, n = 10; Rad50+/46 Atm+/−, n = 5. P-values were determined by unpaired t-test.

