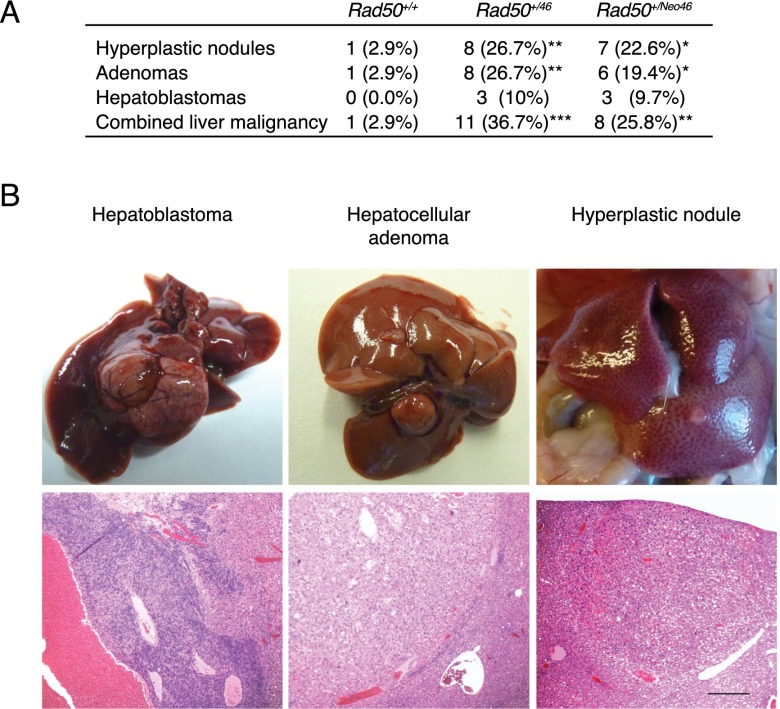
Figure 6.
Rad50+/46 and Rad50+/Neo46 mice develop liver tumors. (A) Frequency of liver tumors developed by Rad50+/+, Rad50+/46, and Rad50+/Neo46 mice by 18 mo of age. P-values were calculated with Fisher's exact test comparing with Rad50+/+. (*) P ≤ 0.05; (**) P ≤ 0.01; (***)P ≤ 0.001. (B) Representative images and H&E staining of the hepatic tumors developed by Rad50+/46 and Rad50+/Neo46 mice. Bar, 200 μm for all images.

