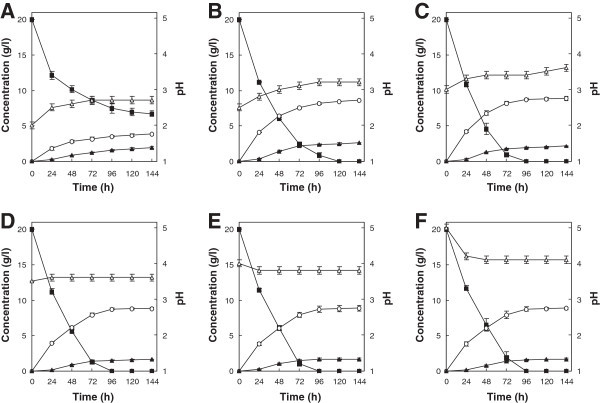
Figure 3.

Ethanol production from xylose by T. versicolor KT9427 at an initial pH of 2 (A), 2.5 (B), 3 (C), 3.5 (D), 4 (E) and 5 (F). Symbols represent xylose (filled squares), xylitol (filled triangles), ethanol (open circles) and pH (open triangles). Error bars indicate standard deviations of the means from three independent experiments.
