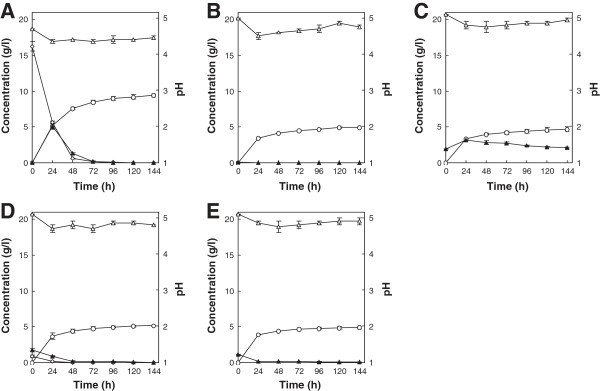
Figure 5.

Ethanol production from starch (A), cellulose (B), xylan (C), wheat bran (D) and rice straw (E) by T. versicolor KT9427. Symbols represent starch (open diamonds), reducing sugar (filled triangles), ethanol (open circles) and pH (open triangles). Error bars indicate standard deviations of the means from three independent experiments.
