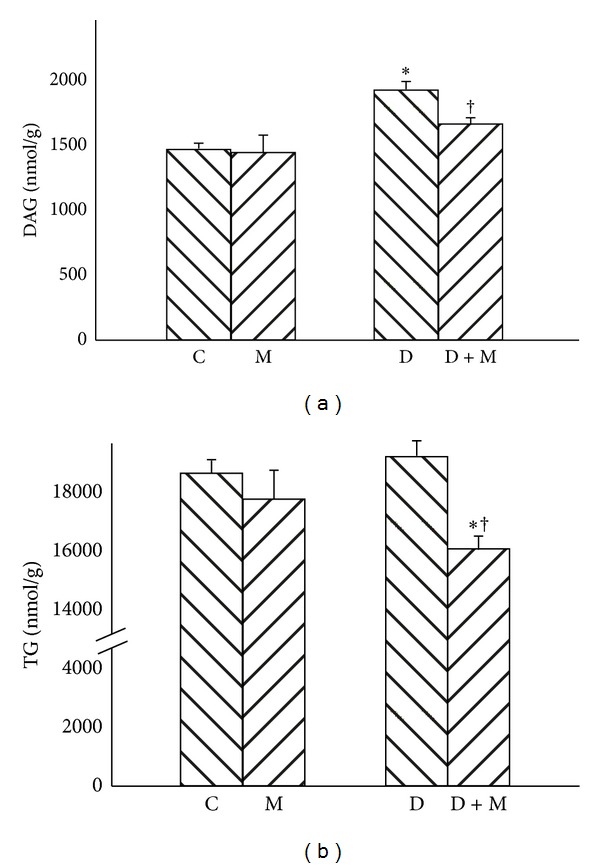
Figure 5.

Effect of myriocin treatment (for 7 days) and streptozotocin-induced diabetes (for 7 days) on DAG (a) and TG (b) contents in liver homogenates. C: control group. M: group treated with myriocin. D: streptozotocin-induced diabetes group. D + M: streptozotocin-induced group treated with myriocin. Results are based on 8 independent preparations for each experimental treatment (means ± SE). *P < 0.01 compared with C group. † P < 0.01 compared with D group.
