Figure 4.

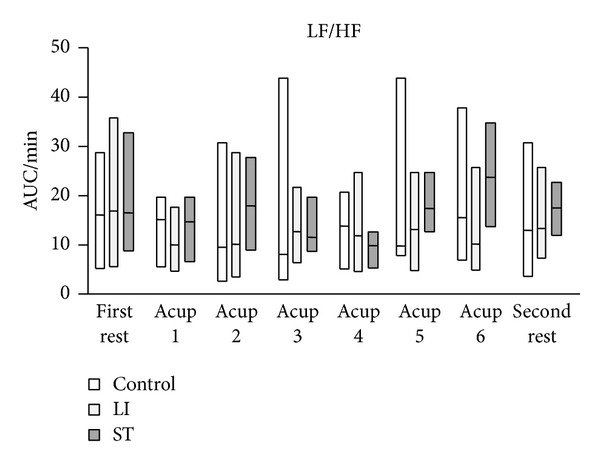
Change in the LF/HF ratio of heart rate variability. AUC: area under the curve. Horizontal bars represent medians and boxes represent the 25th and 75th percentile ranges.

Change in the LF/HF ratio of heart rate variability. AUC: area under the curve. Horizontal bars represent medians and boxes represent the 25th and 75th percentile ranges.