Figure 6.

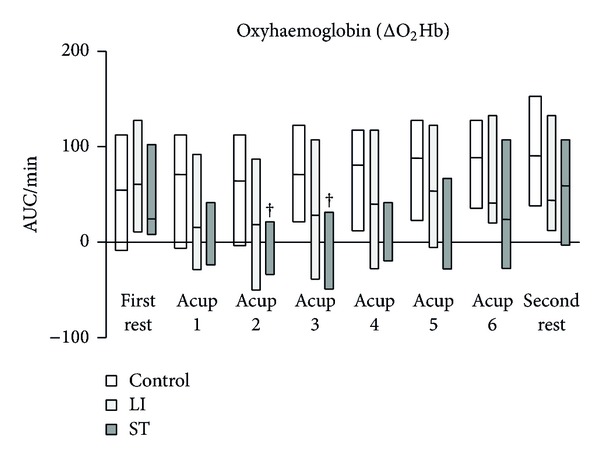
.Change in oxyhaemoglobin (ΔO2Hb) at the trapezius muscles. AUC: area under the curve. Horizontal bars represent medians and boxes represent the 25th and 75th percentile ranges. † Different from the first rest (P < 0.05).

.Change in oxyhaemoglobin (ΔO2Hb) at the trapezius muscles. AUC: area under the curve. Horizontal bars represent medians and boxes represent the 25th and 75th percentile ranges. † Different from the first rest (P < 0.05).