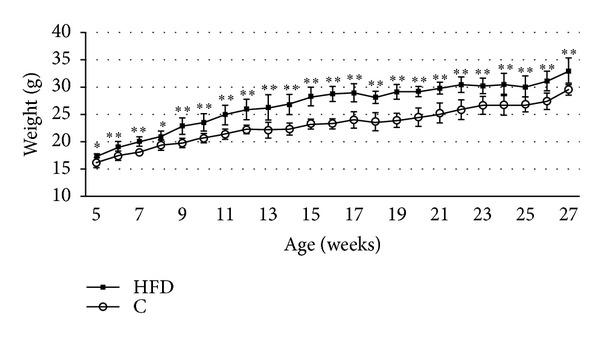
Figure 1.

Body composition. The body weight was significantly upregulated in the high-fat diet (HFD, 60% kcal from fat) mice (n = 7) compared to control (C) mice (n = 6). Significant data were labeled with *P ≤ 0.05 and **P ≤ 0.01. Data are shown as mean ± SD.
