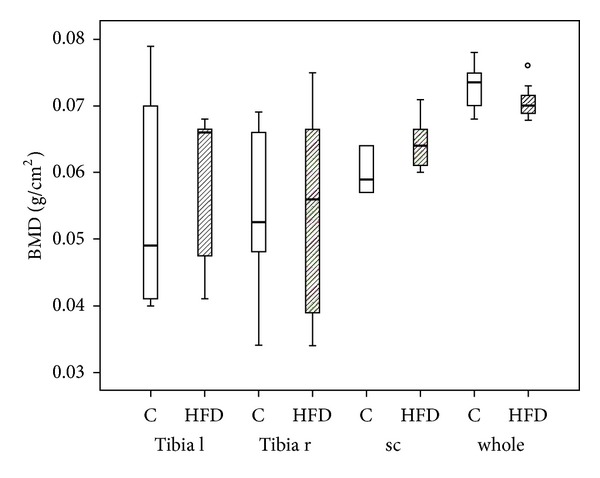
Figure 2.

Bone mineral density. DXA measurement revealed no significant differences in bone mineral density (BMD) between the mice receiving high-fat diet (HFD; n = 7) and the controls (C; n = 6). Data are presented as box plot with the median indicated by solid line within the box. The circle represents data beyond 1.5x the interquartile range of the median. l = left, r = right, sc = spinal column, and whole = whole body.
