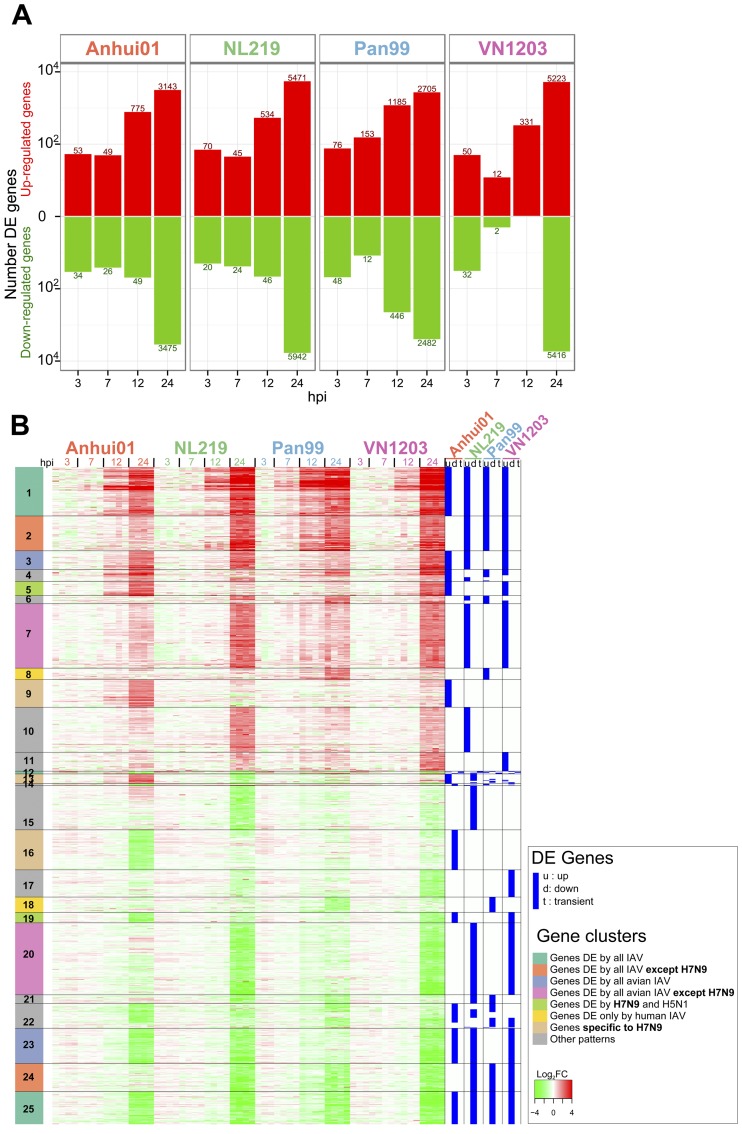
FIG 3 .
H7N9 induces a robust host response at 24 hpi that contains unique signatures and signatures in common with those induced by other avian and human IAVs. (A) Numbers of upregulated (red) and downregulated (green) differentially expressed (DE) genes after infection with IAV compared to time-matched mocks. Criteria used for differential expression analysis are a q value of <0.01 as determined by Limma’s empirical Bayes moderated t test and |log 2FC| > 1.5. (B) Heat map depicting the expression values of 16,327 genes DE after infection of at least one virus at one time point. For each viral condition, DE genes were classified as up- or downregulated across infection or with a transient expression for genes both up- and downregulated during the time course of infection. These DE profiles are shown in blue on the right of the heat map. Genes were clustered in 25 clusters by a constant height cut of the hierarchical clustering dendrogram of Euclidean distance of DE profiles. Functional enrichment for each cluster is presented in Table 1 and in Fig. S1 to S3 in the supplemental material.

