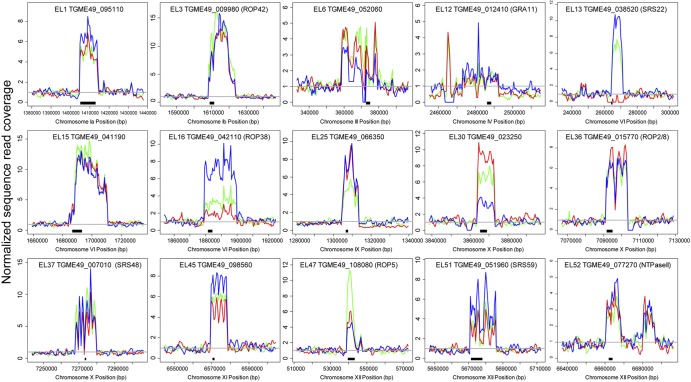
FIG 3 .
Sequence coverage plot for 15 expanded loci in three strain types of T. gondii. Data are normalized to the read coverage in the leftmost 20 kb flanking the expanded locus, and the gray line indicates normalized sequence coverage of 1. Black bars beneath each plot indicate the location of one of the predicted T. gondii isoforms. Information for each locus can be found in Table 1.

