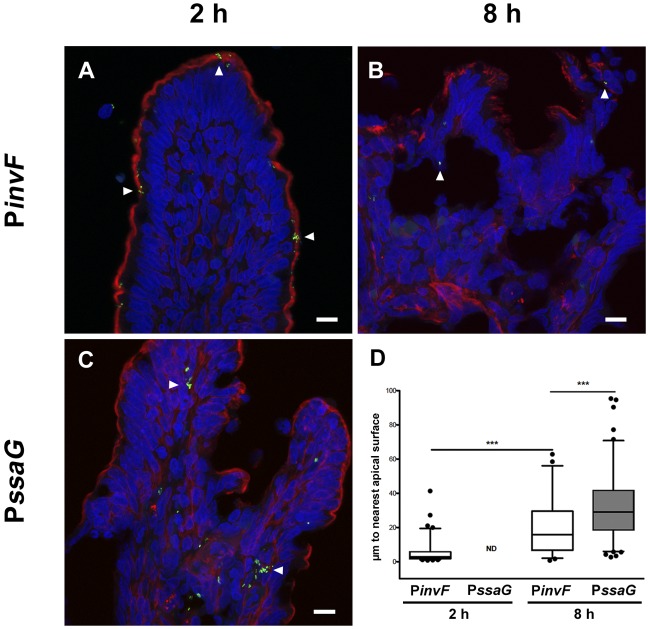
FIG 3 .
Temporal and spatial distribution of PinvF- and PssaG-positive S. Typhimurium cells. Ligated jejunal-ileal loops were infected with S. Typhimurium cells harboring either PinvF-GFP[LVA] or PssaG-GFP[LVA]. (A to C) Representative confocal images of tissue stained for GFP (green), phalloidin (for actin, red), and DNA (blue), with GFP-positive bacteria indicated by white arrowheads. (A) PinvF-GFP[LVA] infection at 2 h p.i.; (B) PinvF-GFP[LVA] infection at 8 h p.i.; (C) PssaG-GFP[LVA] infection at 8 h p.i.; (D) box-and-whisker plot of tissue-associated PinvF- or PssaG-GFP[LVA]-positive S. Typhimurium cells and their distance from the nearest apical surface (assessed from phalloidin staining). Whiskers represent the 5-to-95% confidence interval. • symbols represent outlier data points. ***, P < 0.001. ND, not determined. Numbers of GFP-positive bacteria assessed for distance to the luminal surface were as follows: 82 bacteria at 2 h for PinvF-GFP[LVA]-infected cells, 50 bacteria at 8 h for PinvF-GFP[LVA]-infected cells, and 199 bacteria at 8 h for PssaG-GFP[LVA]-infected cells (values are from samples from at least three animals).

