
FIG 2 .
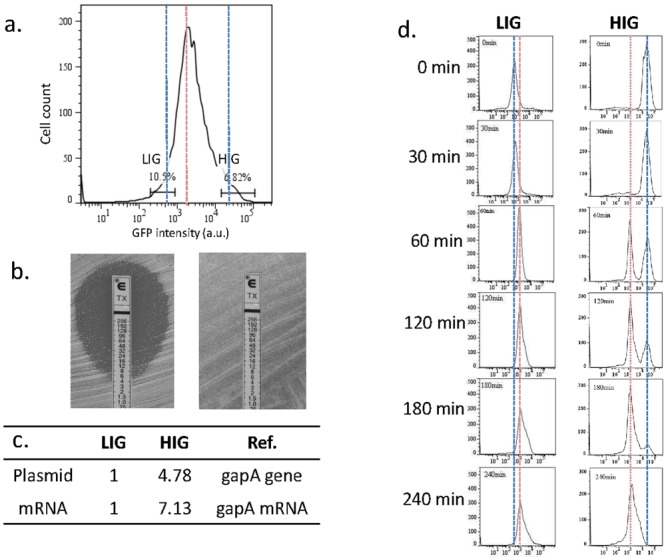
High-intensity group (HIG) and low-intensity group (LIG) cells show differences in resistance to antibiotics. (a) Sorting gates of HIG and LIG cells. (b) Etest of LIG (left) and HIG (right) cells. (c) Copy numbers of the plasmid and CTX-M-14 transcripts in HIG and LIG cells. (d) Dynamic GFP intensity histograms of HIG and LIG cells after sorting. Cells of both subgroups were cultured in antibiotic-free medium and sampled for FCM assay every 30 min for 4 h immediately after sorting. The red dotted line indicates the peak position of the whole population under antibiotic-free conditions, and the blue dotted lines indicate peak positions of the sorted LIG and HIG subpopulations.