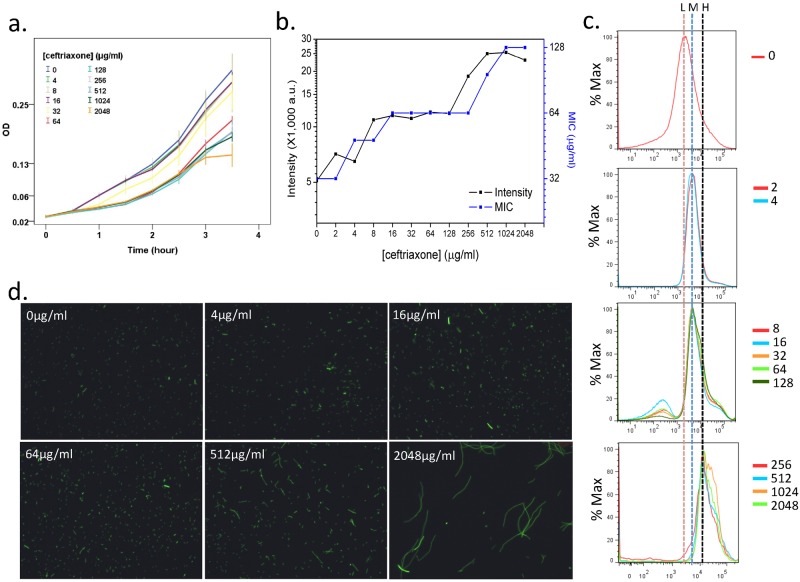
FIG 3 .
Effects of antibiotic on the GFP intensity of the R4 strain. (a) Growth curves of the R4 strain cultured in medium containing serially diluted ceftriaxone. (b) Average fluorescence intensity (left y axis; a.u., arbitrary units) and MIC measured with Etest (right y axis) at the time point of 3 h of ceftriaxone treatment as shown in panel a. (c) Histograms of GFP intensity after 3 h of ceftriaxone treatment as shown in panel a. The y axis in these histograms indicates the percentage of the maximum cell count (% Max), and the color lines indicate the ceftriaxone concentrations (μg/ml) used. Dotted lines labeled with “L” (low), “M” (moderate), or “H” (high) indicate the positions of the major peaks, which shift rightward as the ceftriaxone concentration increases. (d) Fluorescence images of cells after 2 h of ceftriaxone treatment as shown in panel a.

