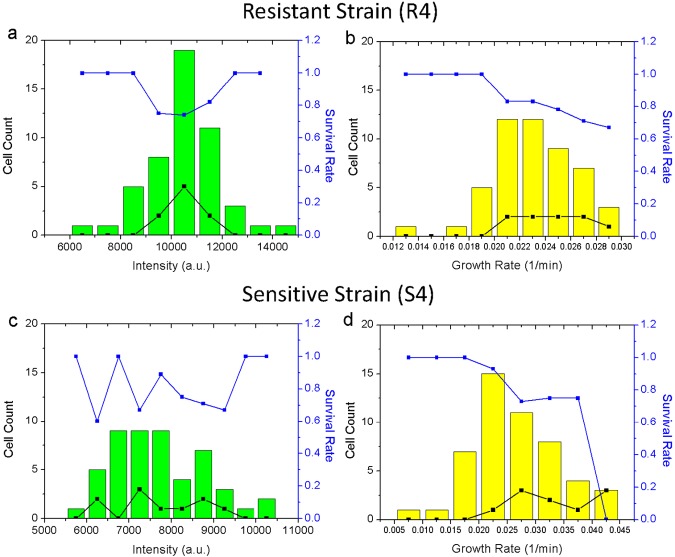
FIG 4 .
Survival rates of resistant (R4) and control sensitive (S4) strains at bactericidal ceftriaxone concentrations. (a) Correlation of death rates of R4 cells with their initial GFP intensities after 2 h of ceftriaxone treatment at the minimal bactericidal concentration (8,192 µg/ml). Cells were binned according to their initial GFP intensities. (b) Correlation of death rates of R4 cells with their initial growth rates after the same treatment as for panel a; cells were binned according to their initial growth rates. (c and d) Graphs corresponding to panels a and b for S4 treated at its minimal bactericidal concentration of ceftriaxone (128 ng/ml). Death count (black squares) and survival rate (blue squares) were plotted together.

