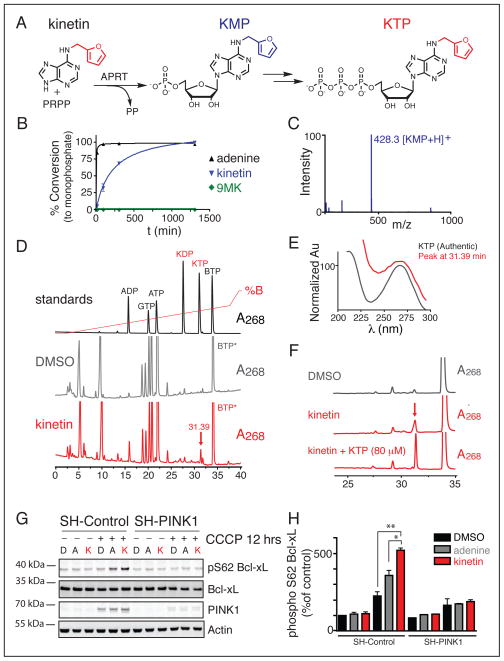
Figure 2. Neo-substrate precursor kinetin leads to KTP in human cells and activates PINK1 dependent phosphorylation of Bcl-xL.
(A) Schematic of the ribosylation reaction of kinetin to KMP via APRT and PRPP followed by cellular conversion to KTP.
(B) LCMS analysis of production of either AMP (adenine) or KMP (kinetin and 9MK) by LCMS analysis reveals that kinetin can undergo APRT mediated ribosylation to KMP, but N9 methyl-kinetin cannot.
(C) LCMS analysis of kinetin reaction; major peak represents KMP+H peak at 428.3 m/z.
(D) HPLC analysis of standards (ADP, GTP, ATP, KDP, KTP, BTP) or cellular lysate of DMSO or kinetin treated HeLa cells with 250 μM BTP* addition reveals a novel peak present in kinetin treated cells at 31.39 minutes.
(E) Absorbance spectrum of peak at 31.39 minutes in kinetin treated cells compared to absorbance spectrum of KTP in standard.
(F) Zoom of HPLC analysis of DMSO or kinetin treated cell lysate with BTP addition, or kinetin cell lysate with BTP addition and KTP addition reveals an increase in the peak that co-elutes with KTP (186%) where BTP decreases to 76% of original area suggesting the peak is KTP.
(G) Immunoblot analysis with the indicated antibodies for phosphorylation on serine 62 of Bcl-xL reveals an increase following kinetin treatment.
(H) Quantitative analysis of data shown in G where a significant increase in the phosphorylation of Bcl-xL on serine 62 with pre-treatment with kinetin versus DMSO or adenine (p=0.01, p=0.04;t-test) in SH-Control expressing cells not in SH-PINK1 cells. (P values shown are the result of two-tailed student’s t-test, *P<0.05 **P≤0.01) (all values shown are mean ± sem)

