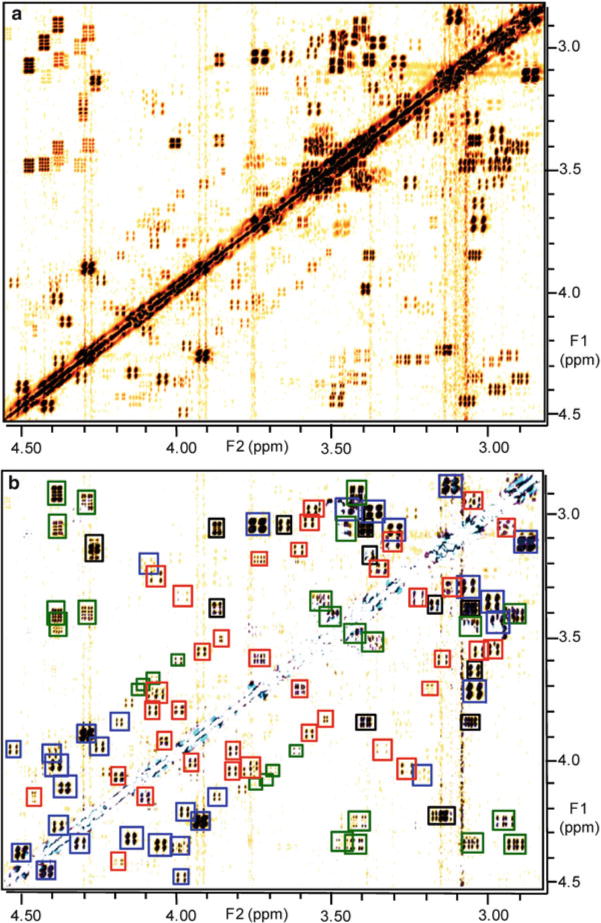
Fig. 2.

Actual DANS spectra from analysis of A. fumigatus gliZ-dependent metabolites (3) (a) Section of the WT dqfCOSY spectrum in absolute-value mode. (b) DANS overlay of WT and ΔgliZ (KO) spectra, showing signals representing known gliotoxin derivatives (blue), novel gli Z-dependent compounds (red), and previously described fungal metabolites (black). Several crosspeaks representing metabolites present in both WT and ΔgliZ were not fully suppressed in the overlay due to chemical shift variation (green).
