Figure 1.

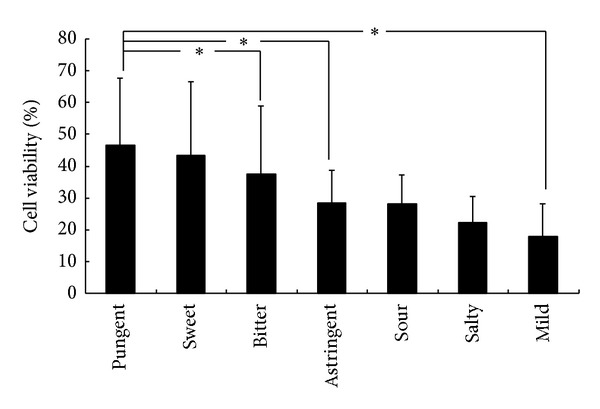
Comparison of herbs with cell viability in different flavors. Average of cell viability of LPS/IFNγ-stimulated RAW264.7 cells treated with herbs belonging to different flavor. *P < 0.05.

Comparison of herbs with cell viability in different flavors. Average of cell viability of LPS/IFNγ-stimulated RAW264.7 cells treated with herbs belonging to different flavor. *P < 0.05.