Figure 2.

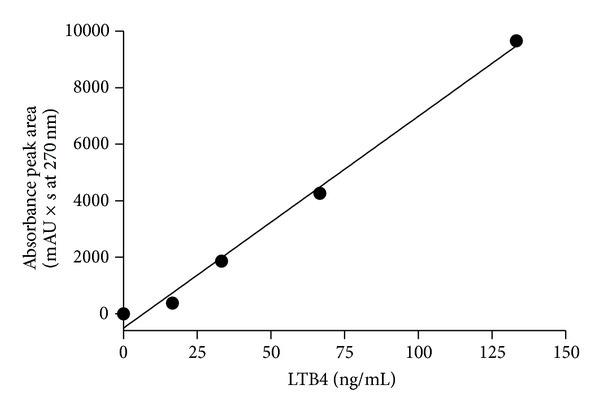
Standard curve between known concentrations of standard LTB4 and corresponding HPLC peak areas; slope = 74.96 ± 3.83, r 2 = 0.9922, P = 0.0003.

Standard curve between known concentrations of standard LTB4 and corresponding HPLC peak areas; slope = 74.96 ± 3.83, r 2 = 0.9922, P = 0.0003.