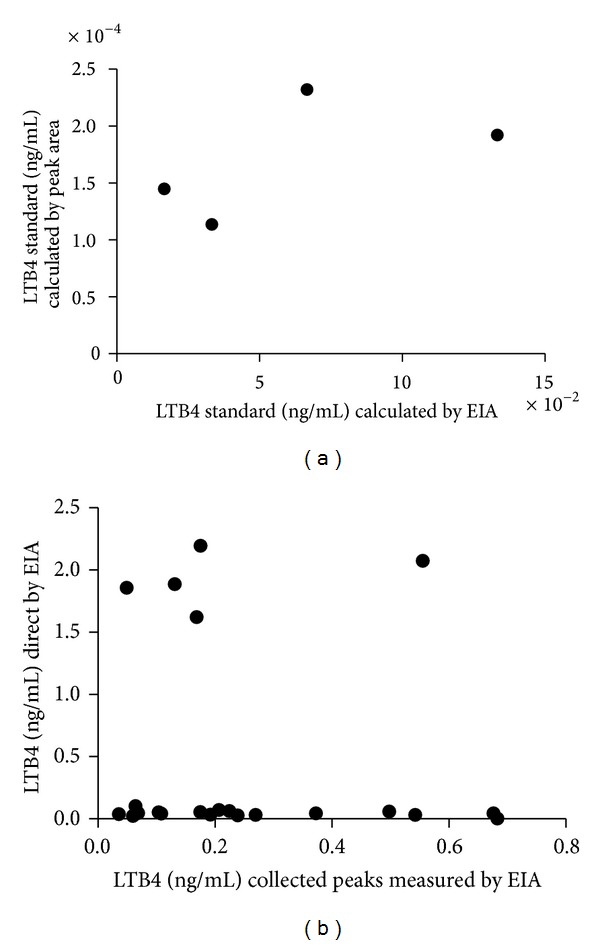
Figure 4.

Comparative regression analysis on (a) concentrations of standard LTB4 measured by EIA in the resulting peaks after HPLC of this standard (n = 4); slope = 0.0006 ± 0.0006, r 2 = 0.3280, and P = 0.4273 and on (b) concentrations of LTB4 measured by EIA in the resulting peaks after HPLC of samples and directly in these same samples without further processing (n = 22); slope = −0.3592 ± 0.8776, r 2 = 0.0083, and P = 0.6867.
