Figure 5.

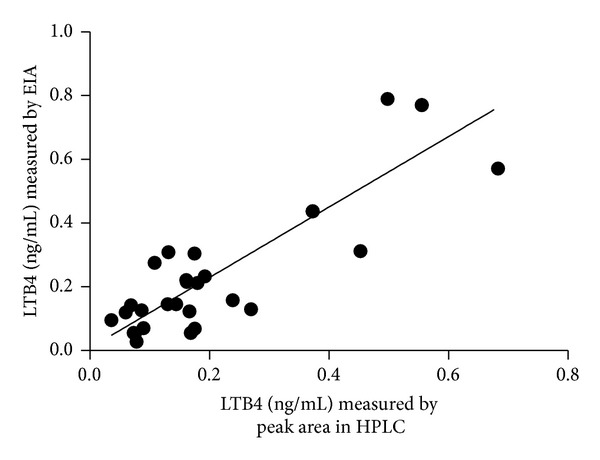
Linear regression between the LTB4 content in all samples under study (n = 36), measured by peak area in HPLC and by EIA; slope = 1.106 ± 0.1207, r 2 = 0.7566, and P < 0.0001.

Linear regression between the LTB4 content in all samples under study (n = 36), measured by peak area in HPLC and by EIA; slope = 1.106 ± 0.1207, r 2 = 0.7566, and P < 0.0001.