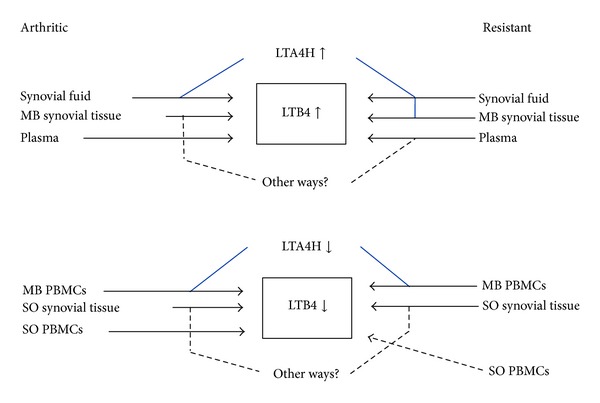
Figure 6.

Changes in LTB4 levels and LTA4H activity in CIA-arthritic and CIA-resistant rats. Arrows ↑ and ↓ indicate, respectively, increased or decreased values relatively to healthy control. Blue solid line indicates the situation in which changes in LTB4 content and LTA4H activity are positively related. Black dotted line indicates the situation in which changes in LTB4 content and LTA4H activity are not positively related. It is noteworthy that changes in LTB4 content and LTA4H activity in all samples allow to distinguish between CIA-arthritic and CIA-resistant only when compared quantitatively (Tables 1–3).
