
Fig. 12.
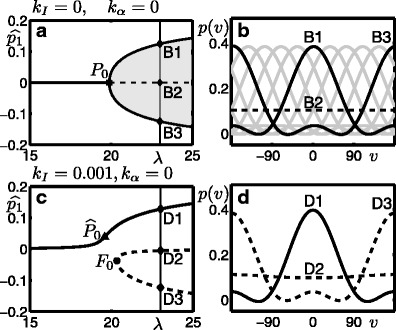
Symmetry breaking of the pitchfork with introduction of a stimulus. a and c show bifurcation diagrams in λ for the no-input and small input cases, respectively; stable states are solid curves and unstable states are dashed curves. b and d show the solution profiles in v-space at the labelled points for λ = 23; stable states are solid curves and unstable states are dashed curves. In panel b the solid black curves correspond to the solution B1, for which takes its largest value and the solution B3, for which takes its smallest value; several intermediate solutions are plotted as grey curves, see text