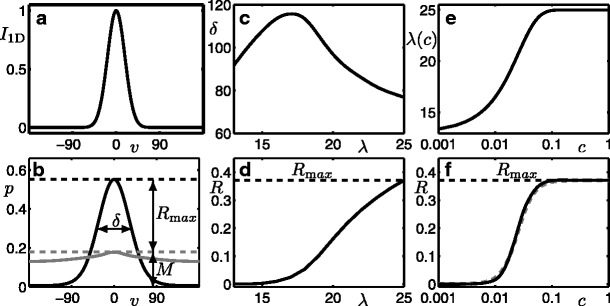
Fig. 14.

Model response for drifting grating stimulus and tuning of λ-dependence on c. a Stimulus profile I 1D(v) for a visual-field-covering drifting grating. b Steady state responses at λ =13 (grey curve) and at λ =25 (black curve); dashed horizontal lines indicate the maximum activity for these steady states. The tuning bandwidth, or tuning width at half-height, is δ and the maximum level of activity above the spontaneous level (dashed grey line) is R. c Tuning width δ of response for λ ∈ [λ min, λ max]. d Normalised response R for λ ∈ [λ min, λ max]. e Variation of λ with respect to c. f Contrast response curve with λ varying as in panel e (black) and the Naka-Rushton function with parameters as described in the text (dashed grey)
