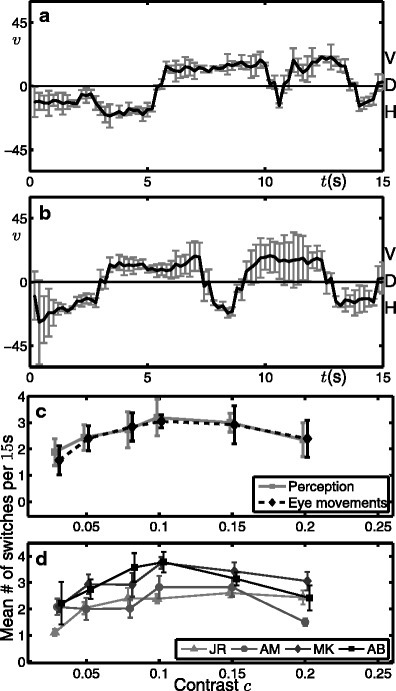
Fig. 8.

Summary of results from psychophysics experiments for the complex stimulus shown in Fig. 4b. a, b Time traces of average direction from eye-movements during two individual stimulus presentations at c = 0.08. Error bars show the standard deviation of the computed direction of smooth components over 200 samples; the re-sampled value at 5Hz is the mean. c Relation between contrast and mean switching rate in terms of perception (reported by subjects) and as computed from eye-movement traces; grouped data is averaged across the four subjects with standard error shown. d Switching-rate data (from perception) separated out by subject with standard error for each subject shown
